
12Sep3:16 pmEST
A Chance to Get Back Above Water

Virtually the entire energy complex has been mired in a bear market for a good while now, be it natural gas, crude oil, and especially energy stocks themselves.
In terms of gauging whether he worst is over, why not look at one of largest firms in the world and largest holding by market cap in the XLE ETF, Exxon Mobil Corporation (XOM)?
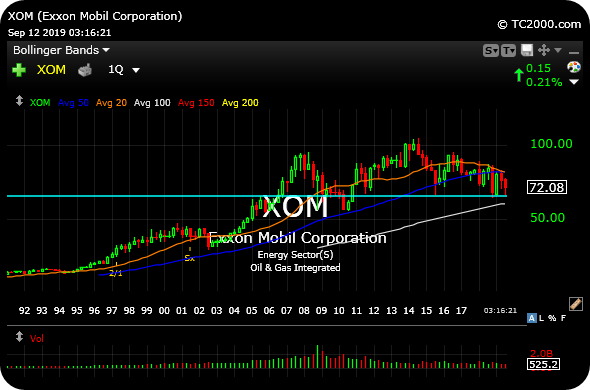
Exxon is at a critical long-term juncture, technically, as seen on the first quarterly chart, below.
Bears will claim the overall sideways churn since 2005 amounts to a mega, long-term topping pattern before a devastating downtrend ensues. That sure is a negative outlook for XOM and, likely, the rest of the energy complex going forward.
But bulls will counter that topping patterns usually do not take that long to form. And the more likely scenario is that XOM has simply been in a massive holding pattern before another secular uptrend, likely coinciding with whenever we see the return of inflation or at least a commodity bull market.
To make this analysis more tangible, if XOM loses the $66 area again (highlighted in light blue) I expect it to coincide with another sector swoon which could lead to some more of the smaller, debt-ridden energy firms going belly-up. But so far XOM has held it well. And the high yield corporate/junk bond ETFs (HYG, JNK respectively) are acting very well, not hinting at imminent pain in the sector).
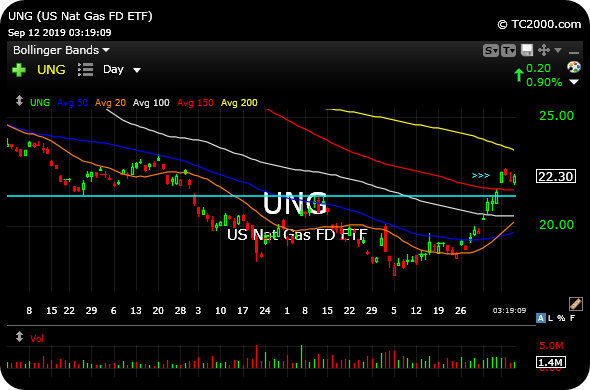
In addition, natural gas, using the UNG ETF as a very rough proxy, is quietly acting much better with winter now a few short months away.
The second chart below is of the UNG daily. As long as $21.40 now holds into dips I like what I am seeing for at least a swing long attempt in what has been a dreadful ride lower for a long time.
Man the Fortinet in This Bat... Gotta Keep Hustling Like Ray...


