
18Mar11:45 amEST
Social, and Technical, Distancing

From a financial and market standpoint, 2011 is a year most likely remembered for the European sovereign debt crisis. A heavy late-summer correction gave way to several months of some of the most wildly indecisive price action we have seen until recently. In hindsight, the mid/late-2011 move in equities is best categorized as a deep correction and/or relatively mild bear market after the initial plunge. After New Year's Eve, 2012 kicked off a bull party for the next few quarters.
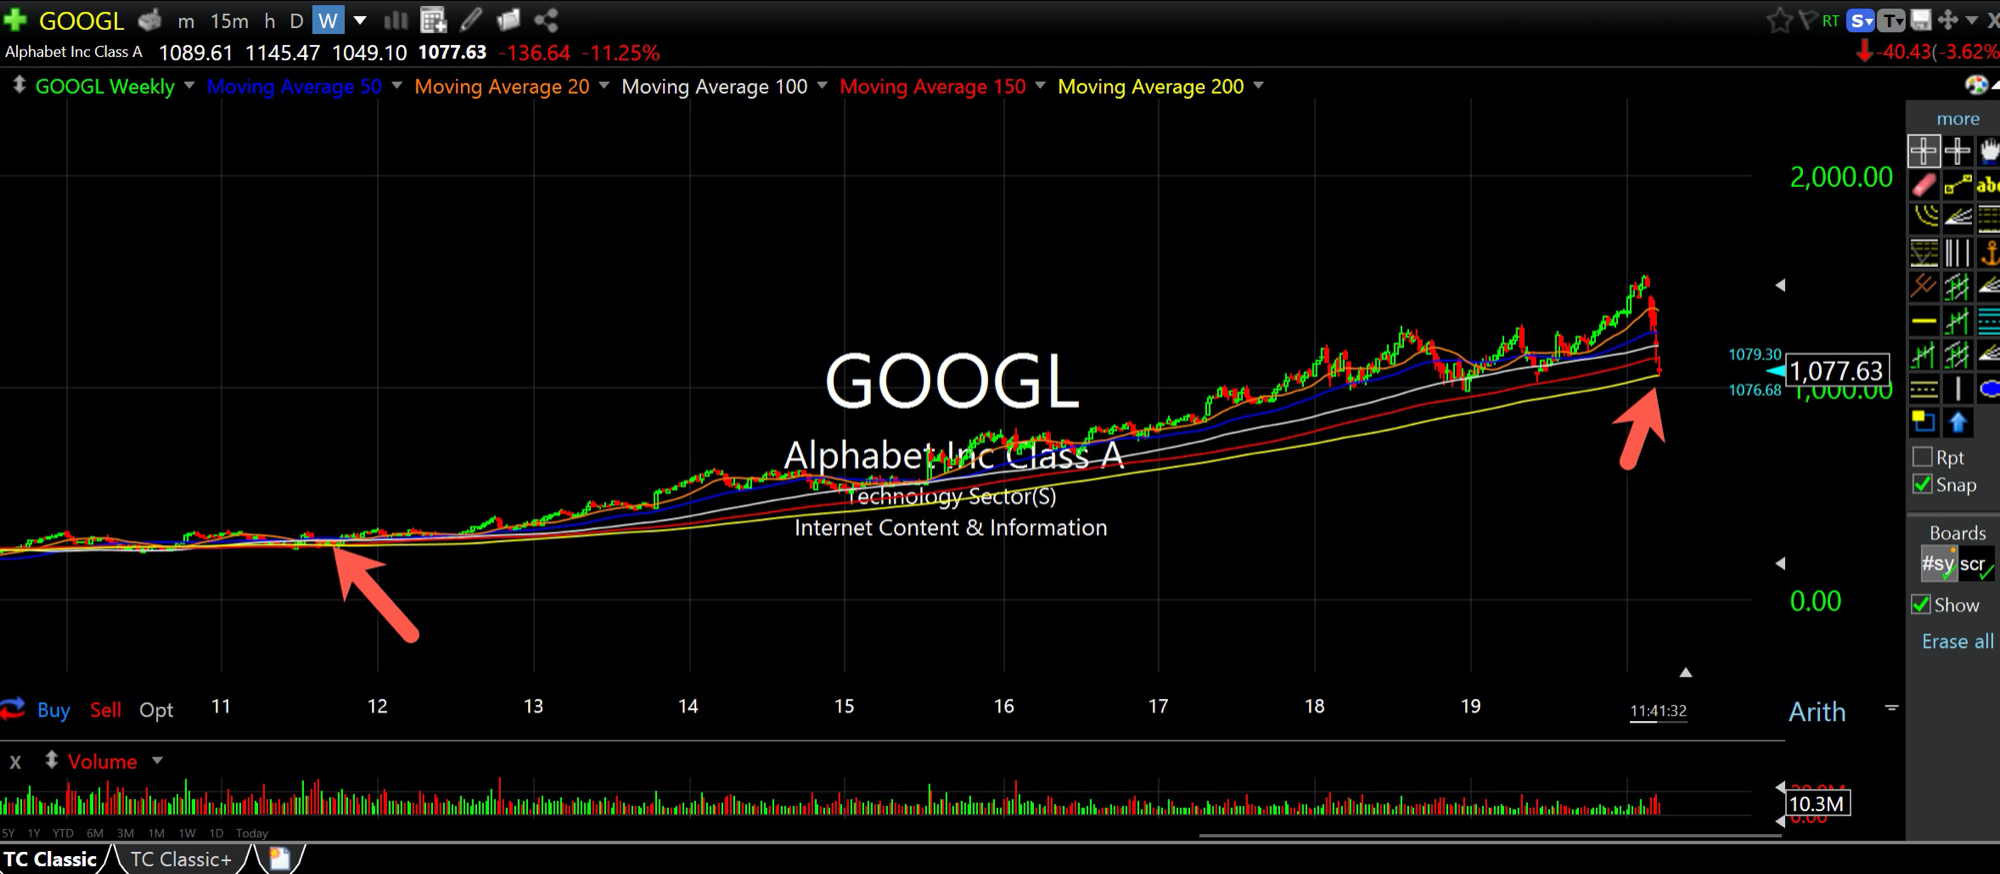
2011 was also the last time that Alphabet, or Google back then, tested its 200-period weekly moving average, the yellow line on my super zoomed-out weekly chart, below. The 200-period weekly is the sort of long-term reference which powerhouse stocks in secular bull markets rarely test. And GOOGL certainly qualifies as much, always in thick of things in terms of market leadership and dominance in tech.
With the Corona Crash in motion, GOOGL tested its 200-period weekly this week, undercutting it by a few basis points and currently about thirty-points above it. This is a rare and noteworthy test. Even those who mock the mere use of moving average always seem to sneak a peek at them in times of extreme distress, such as this market.
And, typically, they will look at something like the 200-DAY moving average on the Dow or S&P, which has its own merits.
But the criticism of those who use moving averages properly simply illuminates their ignorance--Moving averages are best used as reference points and ways to gauge underlying strength, or lack thereof. Moving averages also help to define risk. Moving averages are not a secret-sauce indicator, or anything remotely close to it.
Here, we use GOOGL's 200-period weekly moving average this week and beyond to gauge the true extent of this carnage: Will a powerhouse QQQ names like GOOGL completely fail at a long-term reference point it has not so much as touched since 2011 (you want to talk about social, and technical, distancing?!).
Or, instead, will some semblance of demand and balance come into play with buyers acknowledging the uncertainty but at least seeing some value here. Yesterday's bounce was promising for GOOGL. And while the broad market is not far from a circuit breaker thus far today, GOOGL is above yesterday's lows of $1,049, a mere three points below, you guessed it, the 200-period weekly moving average.
Watch it.
Stock Market Recap 03/17/20 ... Full-Length Stock Market Rec...


