26Mar3:10 pmEST
Going Through the Cycle

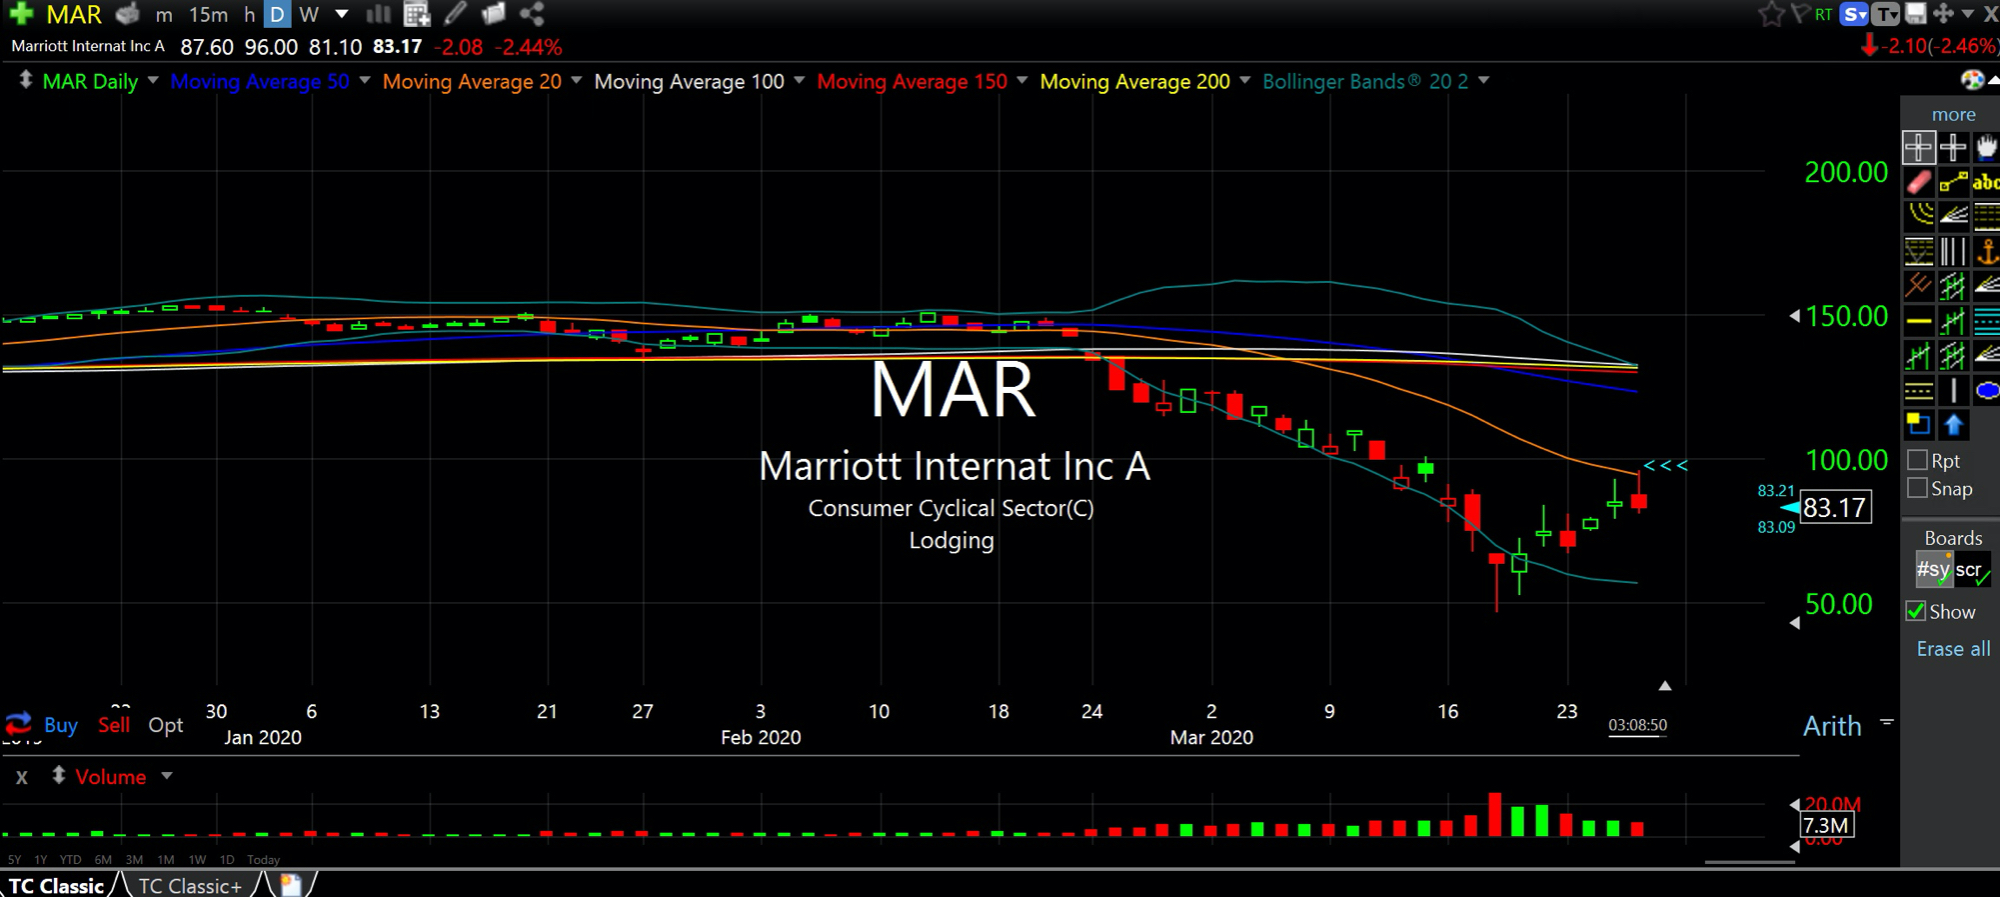
Bollinger Bands, the eponymous indicator John Bollinger created, are seen on the daily chart for hotel chart Marriott, below.
And as one of our Members astutely notes, MAR is one of a slew of names "kissing" a 20-day simple moving average (orange line, arrows) and reversing back to red this afternoon despite another shock-and-awe rally on the senior indices--WYNN is another example.
Recall that price and volume are the two bookends for technical analysis. The majority of indicators are derived from them. Moving averages are best used as reference points and not magical places to act, per se.
An indicator like Bollinger Bands should be seen as a tertiary indicator, albeit a rather useful one when applied to markets reverting after a powerful move, such as this one.
Specifically, with the price expansion sharply lower in equities in recent weeks, a standard reversion move would be a bounce from the "lower" Bollinger Band, which you can plainly see, below, to the "middle" Bollinger Band.
So where is this middle Band?
The "middle" Band is regarded as the 20-period moving average on any given timeframe. Here, the daily chart means the 20-day moving average is our middle Band.
Seeing as many other charts are back to their middle Bands, with the indices closing in on their own, my bias is shifting towards looking for more signs of rejection at these levels due to the likelihood of the powerful downswing still a clear and present risk.
While I recognize the sentiment in the air has shifted from downright fear and horror of a widespread pandemic and widespread economic shutdown to somewhat of a festive "we are back" atmosphere this week and especially today, that is to be expected during bearish trends.
The issue now is whether sellers avoid trapping themselves by shorting too early and fueling another squeeze higher into the weekend and perhaps next week, too. Hence, using the middle Bands on a variety of charts will offer up a well-defined test beyond the mere emotions of the moment.


