22Apr11:25 amEST
Head and Shoulders Tops Never Work, You Guys

...except when they do.
Since the 2008 and even 2000-2002 comparisons by now are a bit played out, let us examine the summer swoon of 2011 (which actually lasted deep into autumn) for reference.
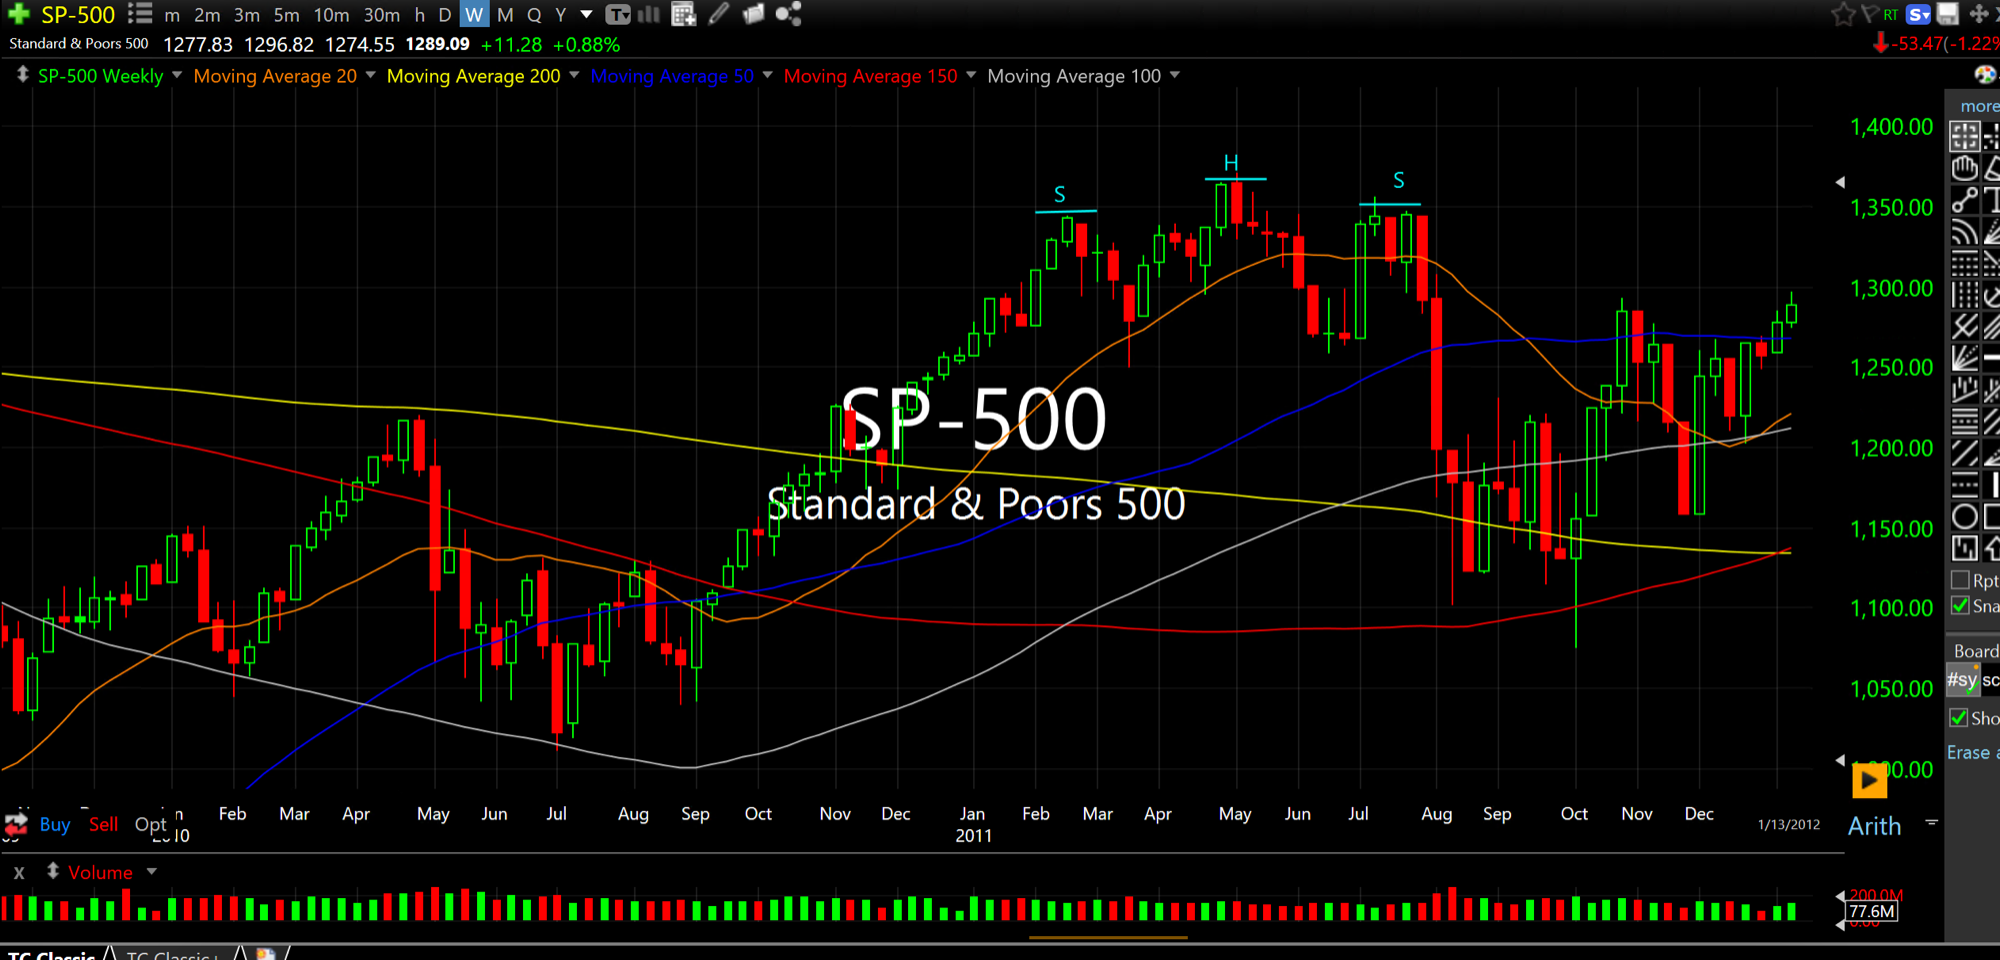
The first chart, below, is the weekly chart for the S&P 500 Index from the year 2011, showing about a is month topping process yielding a sharp head and shoulders bearish top breakdown. Back then, we had a European debt crisis, domestic debt ceiling debate, alongside noticeably declining breadth and stock leadership. And in terms of sentiment, complacency was running uniquely high (including yours truly at one point). This all led to a violent, abrupt move lower with a VIX super spike. There was no V-bottom, as we flopped and chopped around sideways for months. Eventually, in early-2012, the bull resumed.
But that was a classic, non-2008 and non-dot-com example of a valid head and shoulders top which triggered amid complacency in the face of glaring issues both in terms of macro and market dynamics.
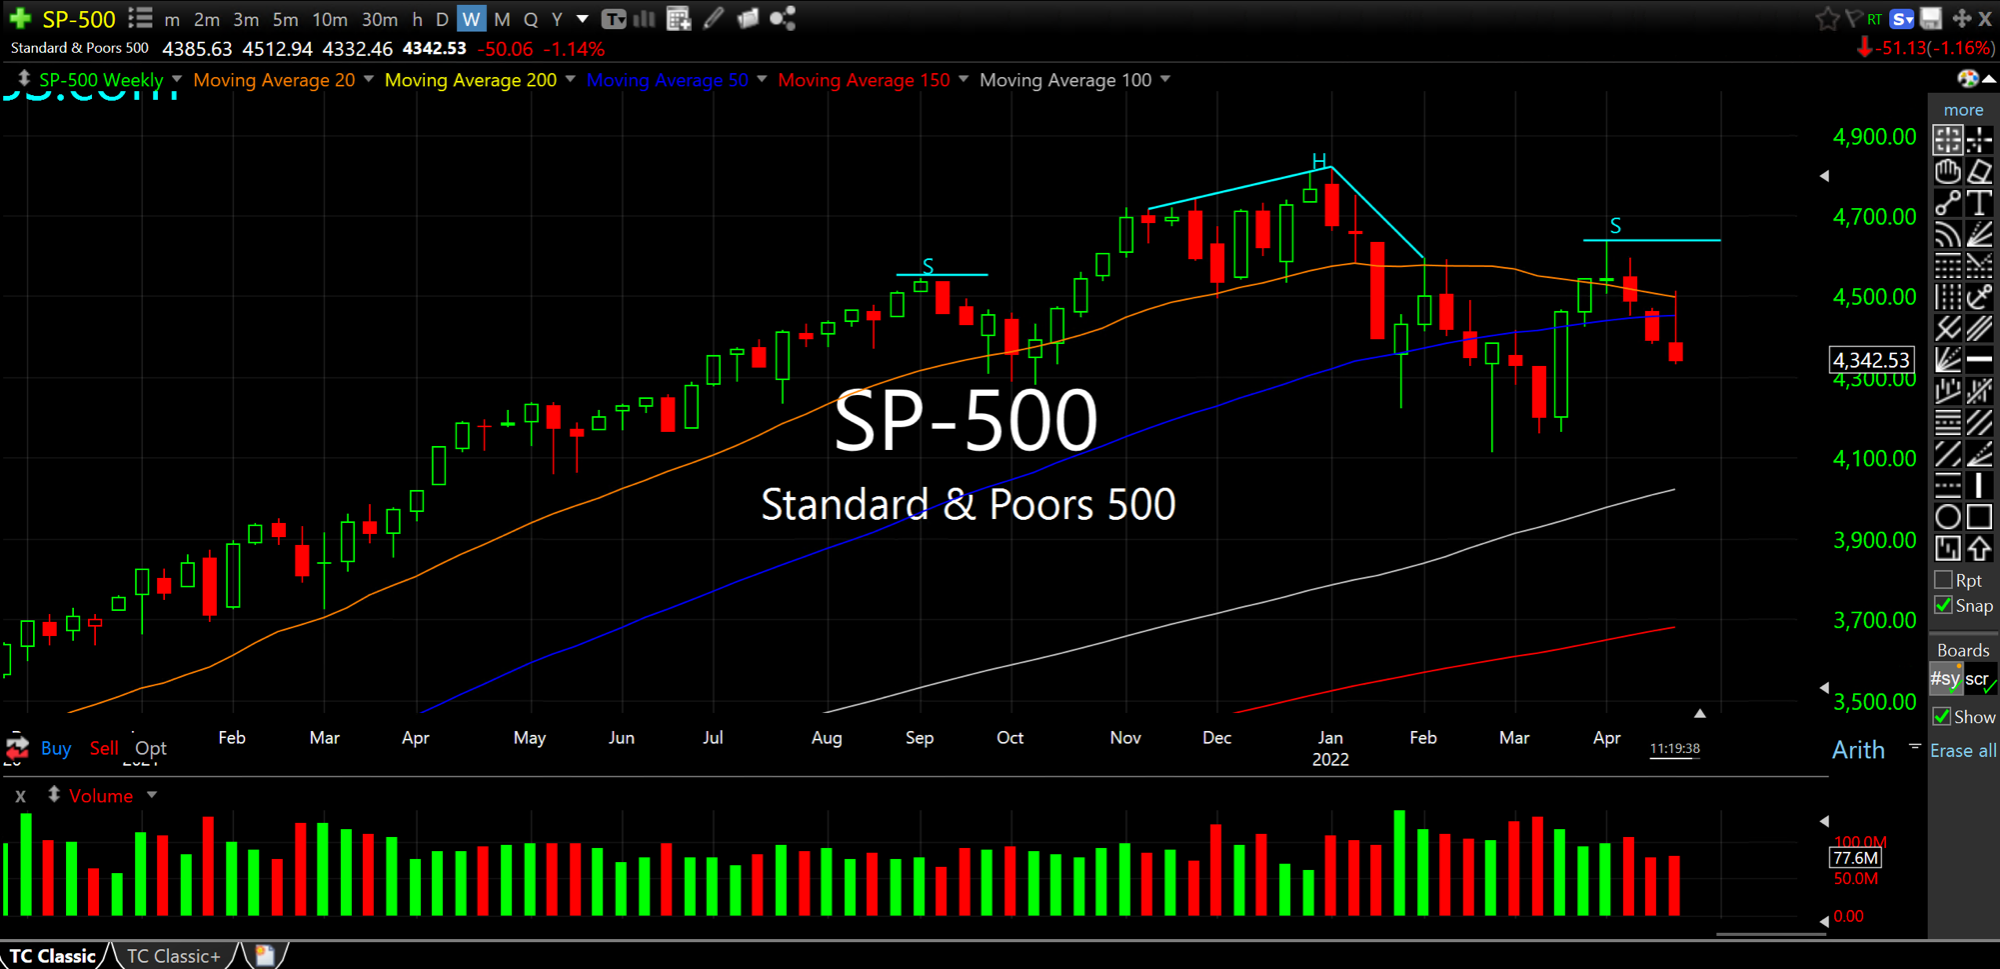
The second chart is the current weekly of the S&P. The current top is around six months-plus, with the recent rally in late-March being turned away by sellers. If this top is valid, then I expect more fear to come into the market sooner than later as it finally dawns on bulls that the regime has shifted and their bold dip-buys are in vain.
Overall, a move back below 4100 on the S&P which holds is necessary to absolutely confirm this top. But the setup is clearly there, in terms of technicals, prior market leaders deteriorating, complacent sentiment, and a laundry list of genuinely concerning headlines which do not appear to be abating.