
12Jul10:19 amEST
Celebrating What's Swept Under

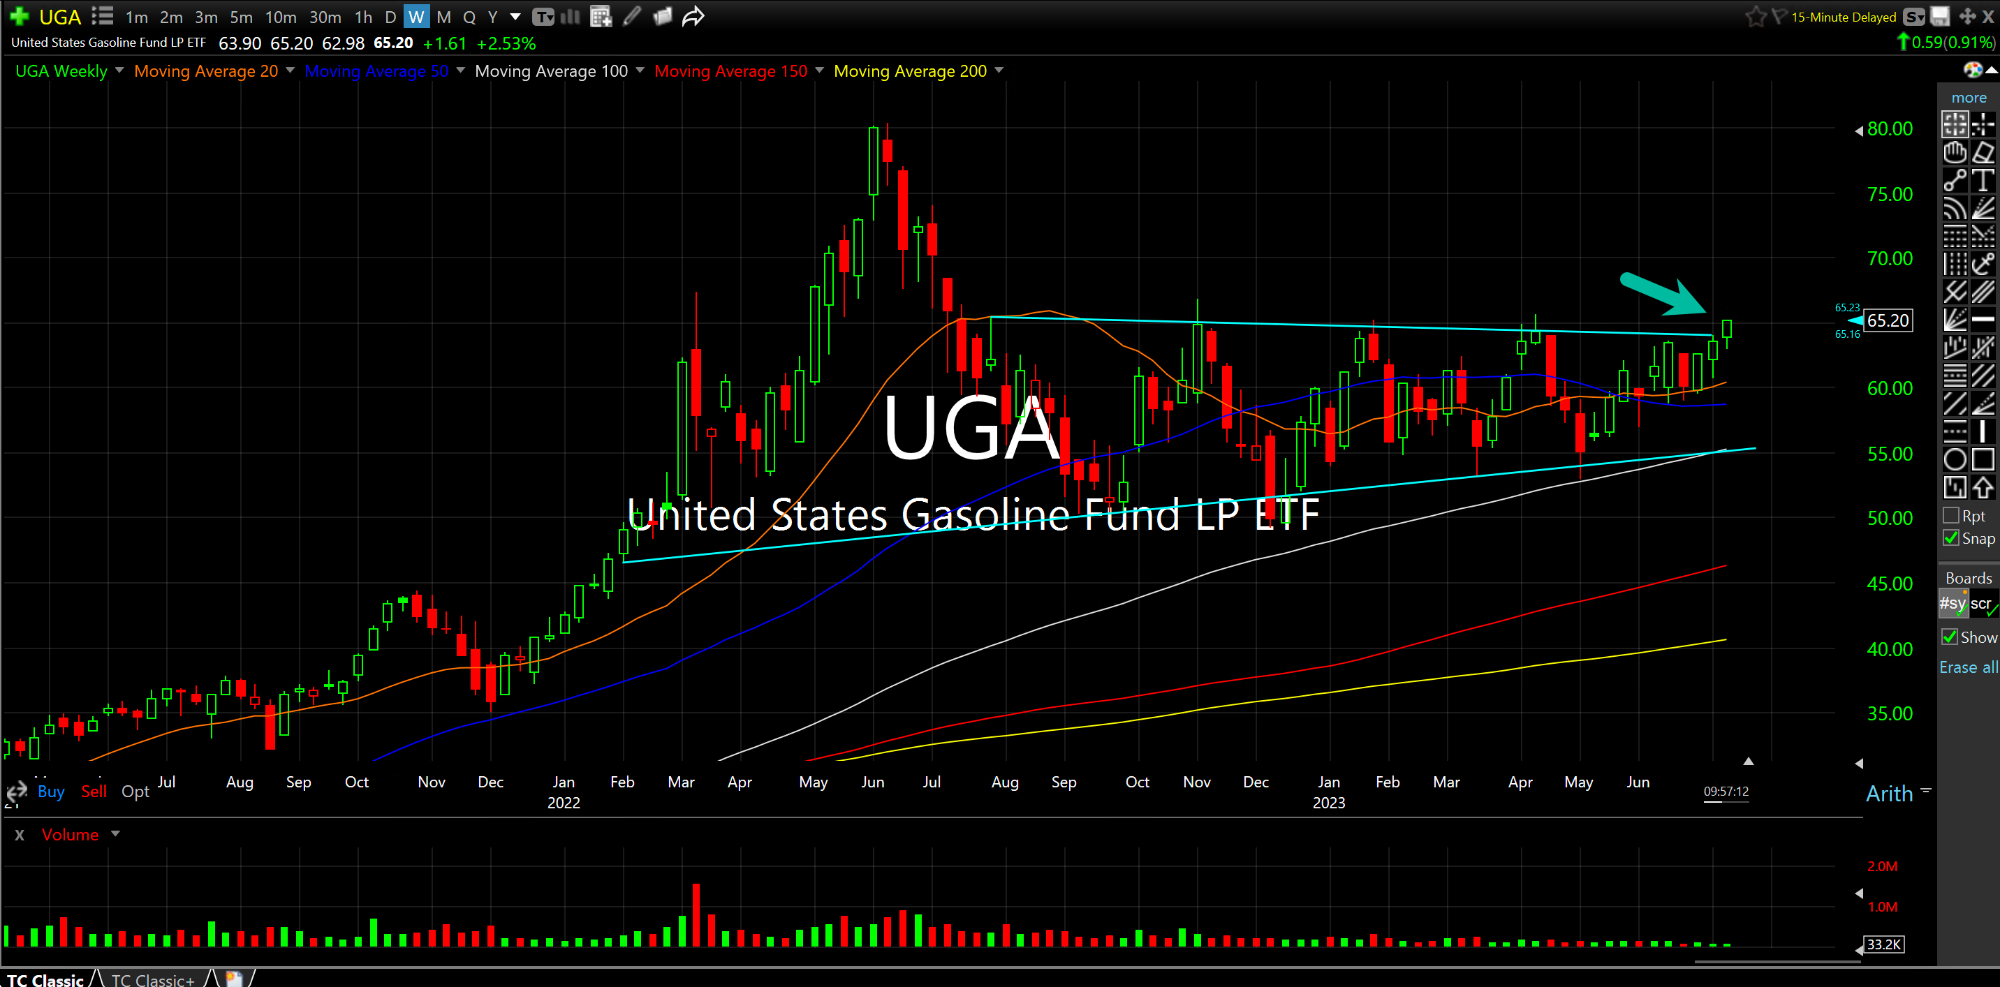
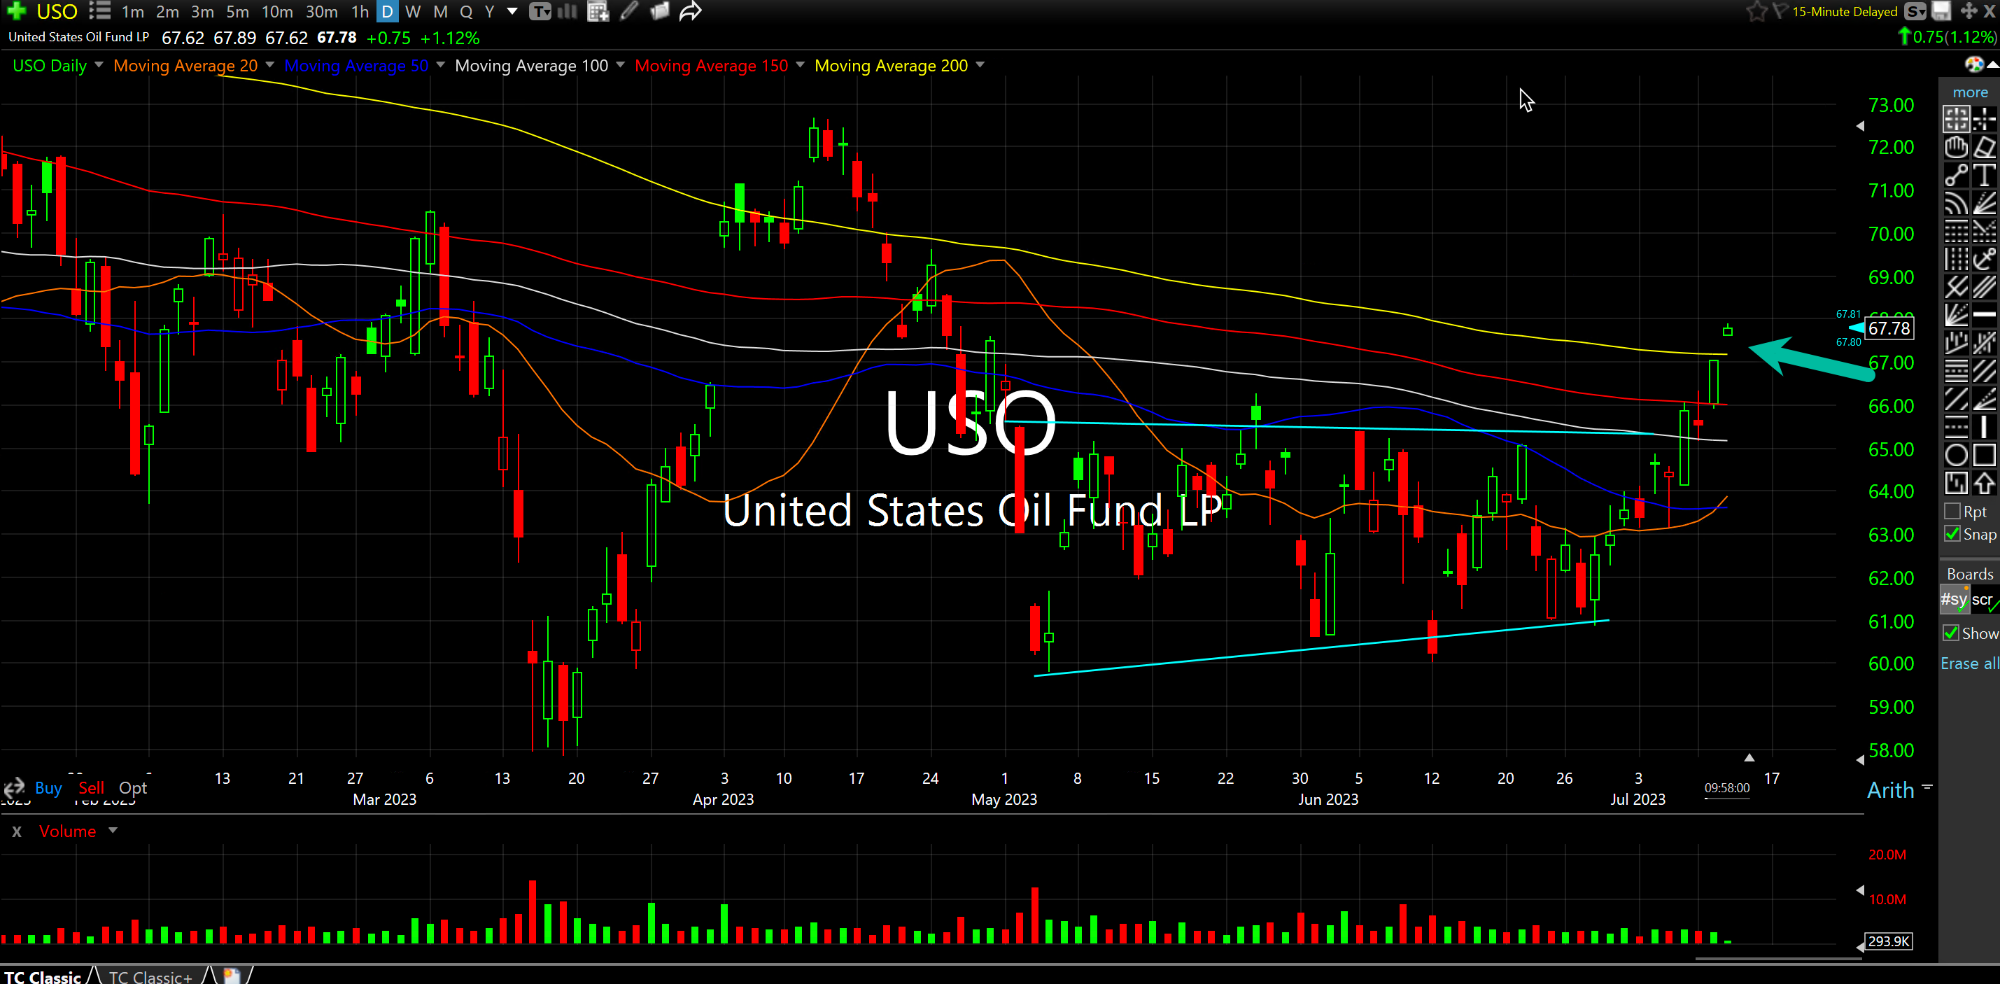
Markets are still ebullient as I write this, with the softer CPI print this morning going as expected for the majority. The issue is that since the June CPI data, we have gasoline prices and oil going much higher, as seen respectively below on the daily charts for UGA and USO ETFs.
Even though energy is only one part of the CPI, it is surely a major part, especially when including both crude and gasoline prices.
All major indices are now at their upper daily chart Bollinger Bands which officially confirms overbought conditions to align with the CNN Fear & Greed indicator remanning in "Extreme Greed" territory for nearly a month now, with only intermittent dips into "Greed."
Back in December 2021 I made a rather uncomfortable and unpopular call here at the time that growth stocks had put in a major top. Since then, the majority of growth stocks are still well below their 2021 highs, with most not likely to come back, perhaps forever. The factors not seem even more aligned for a major top, not just in growth stocks but the major indices, this time around, when you factor in rates, valuation, sentiment, stretched technicals on leaders, etc..
So I am looking to see when markets begin to "look through" today's backward CPI print and start to price in the energy pop as the base effect for year on year inflation resets in July, too.
Stock Market Recap 03/23/20 ... Stock Market Recap 03/24/20 ...


