12Sep10:57 amEST
Let's Find the Real Apex Predator

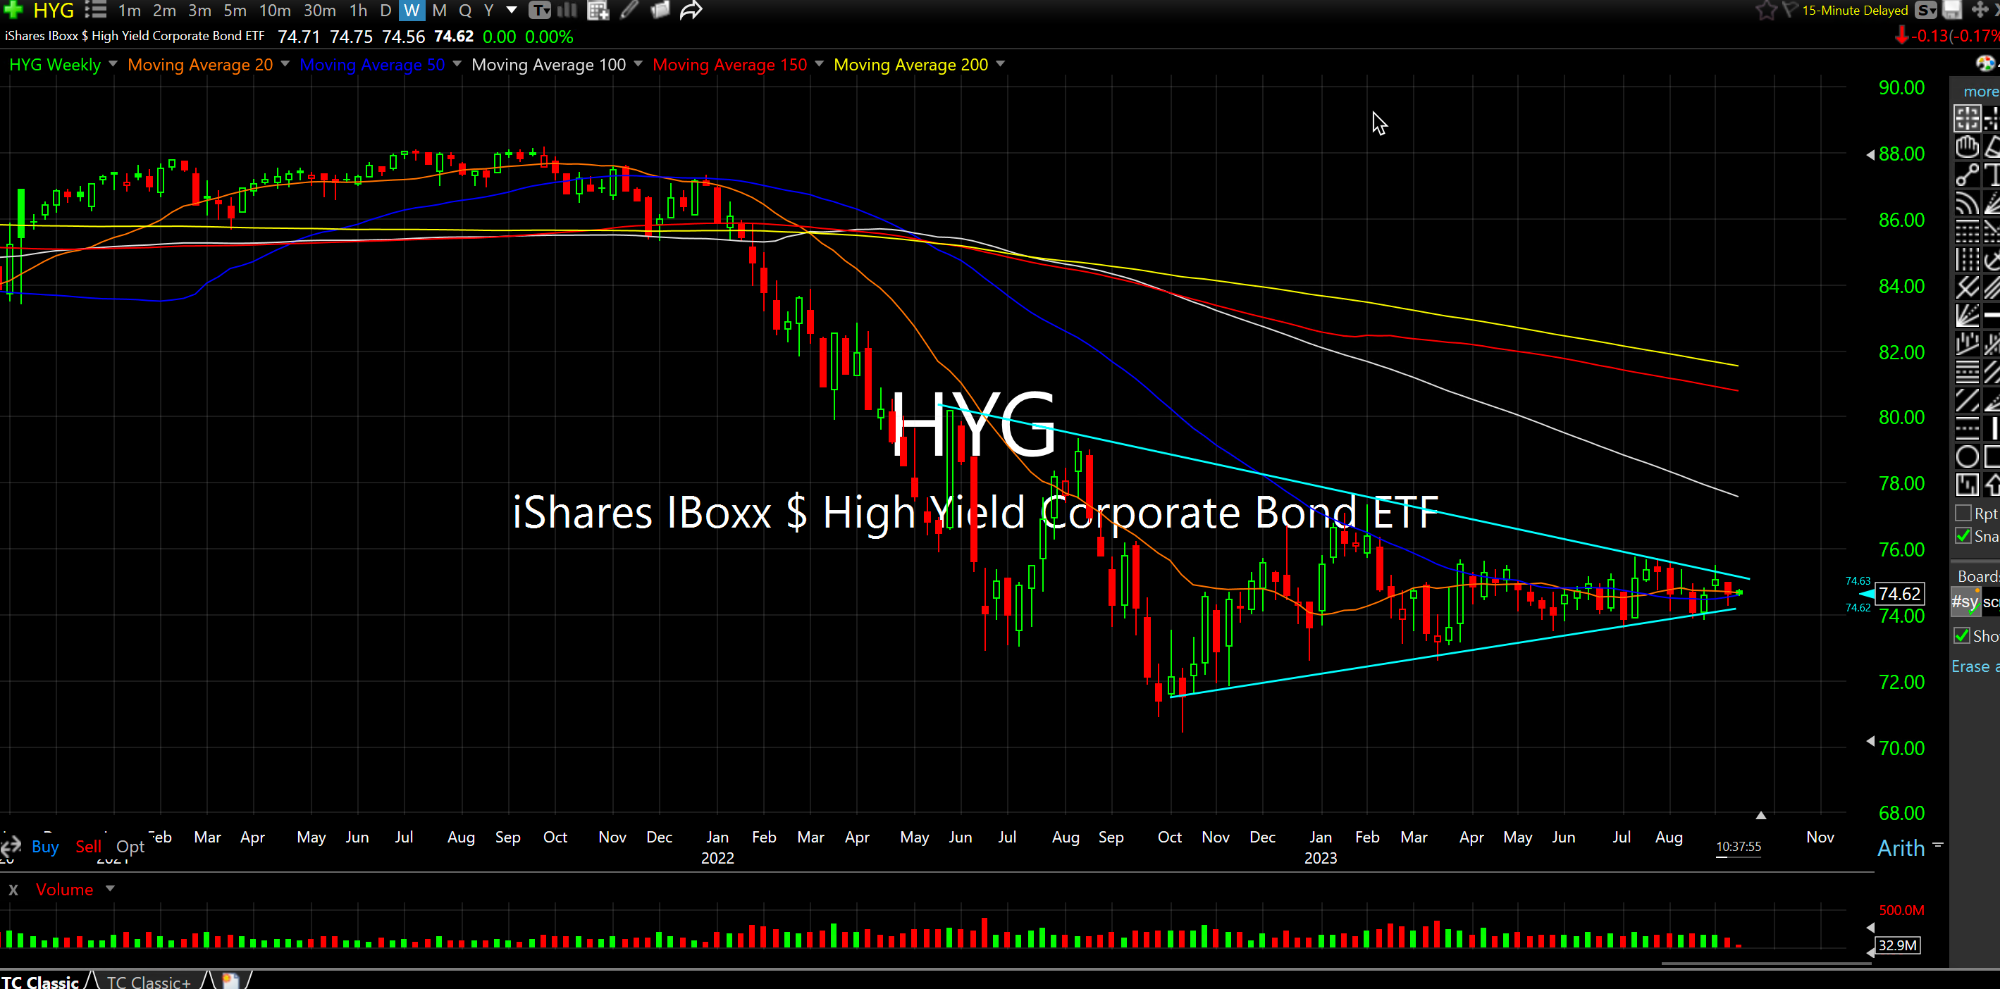
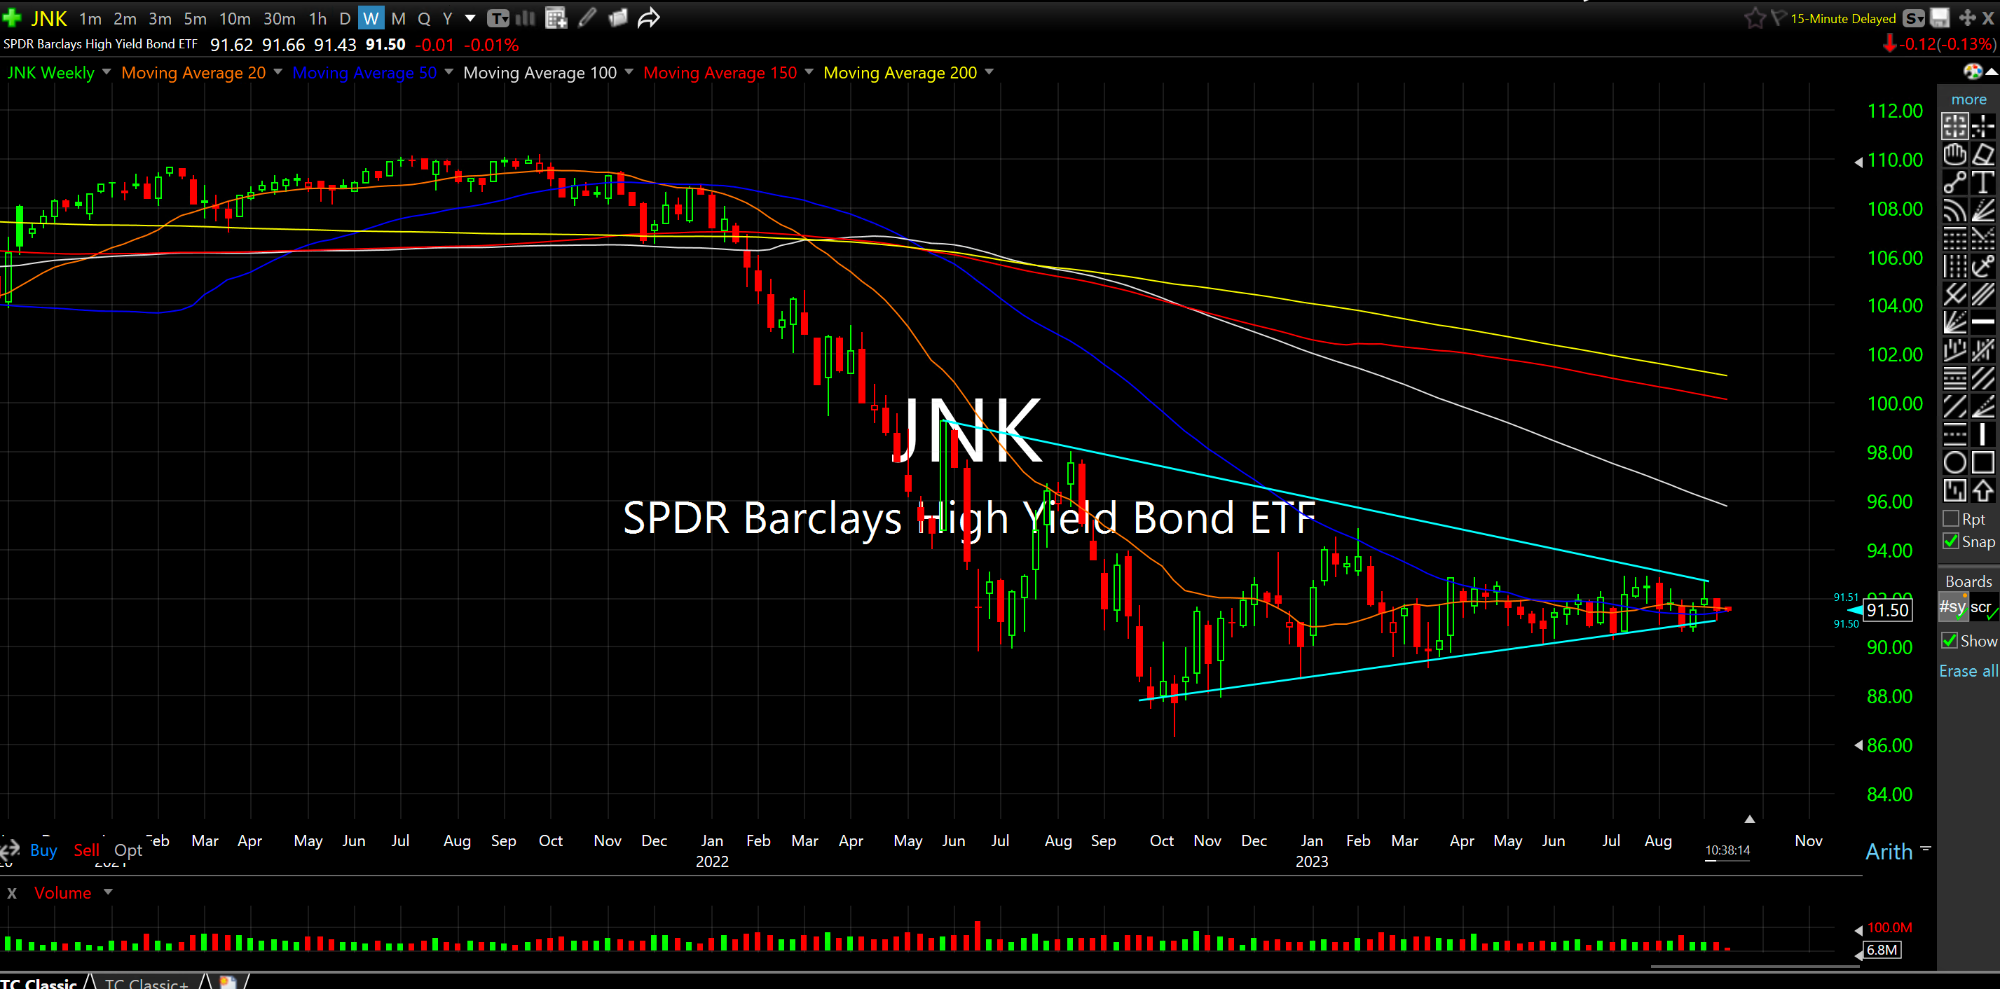
As we head into what are highly likely to be the pivotal events for the rest of 2023, namely the CPI tomorrow, then the FOMC next week, it is worth noting that both the High Yield Corporate Bond and Junk Bond ETFs, respectively below on their weekly timeframes, are at their apexes after roughly sixteen month consolidations each. From periods of technical compression often come explosions. So when you see massive triangles work towards their apexes it should put us on watch for an imminent directional break, just when it seems like the compression will last forever.
Furthermore, these charts are relevant since it is often the case that credit leads equities, and when it comes to high yield that becomes all the more magnified due to the higher risk nature. You can almost feel the tension building as bulls have made their bets that the inflation cycle is at or near its end, while bears are likely split into two camps: The deep recession/deflation with the big "lag effect" from the monetary tightening, versus the higher-for-longer case for higher rates and sticky inflation.
If the bull case proves true, these charts should resolve sharply higher. In either bear case I expect these charts to head much lower and catch tons of market players (and institutions) in vulnerable positions.


