20Oct11:19 amEST
The Granddaddy of Them All

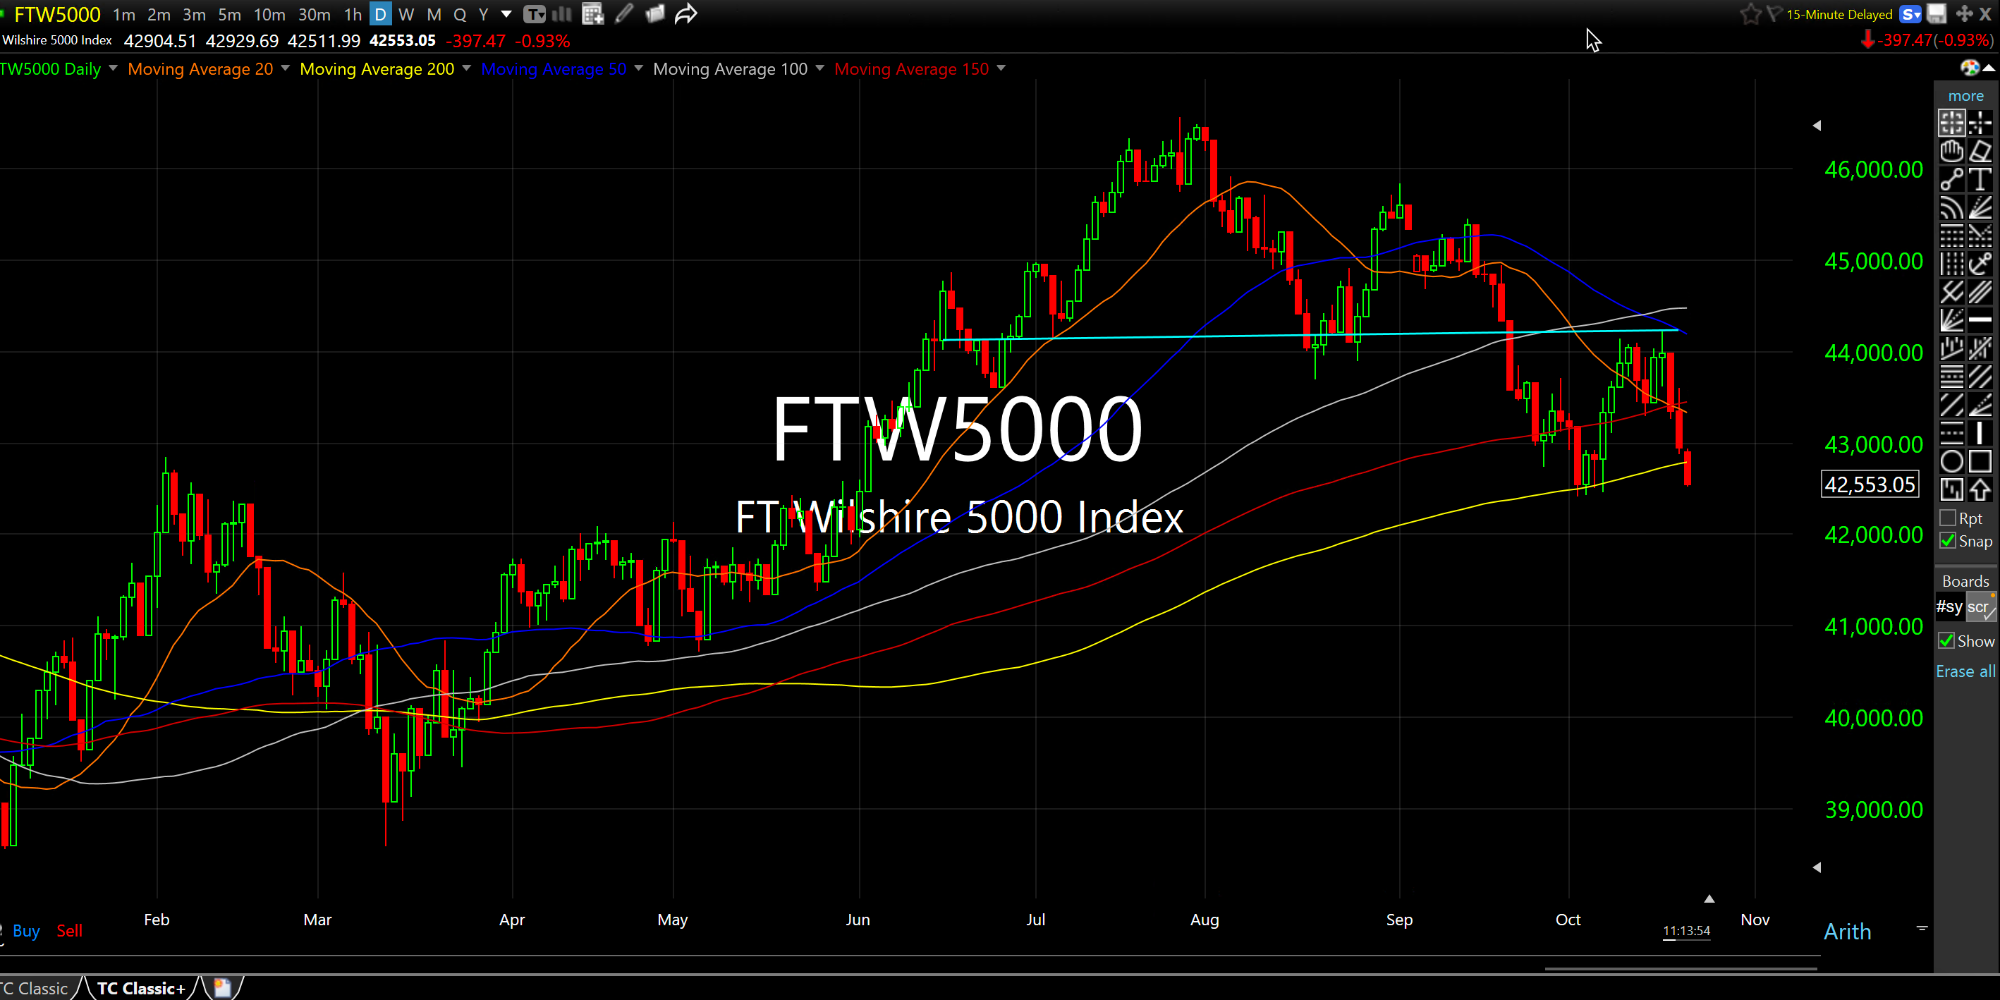
The big Wilshire 5000 Index, below on its daily timeframe, tracks every single stock traded in America, weighted by market cap. After a bounce off the 200-day simple moving average (yellow line) earlier this bounce, we are on track to see the Wilshire close back below the 200-day into the weekend on this options expiration Friday.
This is all happening with what is still an orderly pullback with very little in the way of actual fear. While I recognize some newcomers (or veterans who seem to be suffering from memory loss) may deem the current market dip to be the epitome of palpable bearishness and fear, the reality is that compared to prior markets in Wall Street's history, this is still child's play: There simply is very little in the way of disorderly, emotional selling. And a VIX in the low 20s aligns with that view.
However, the risk for bulls is that they are the proverbial frogs in the boiling water. One minute they are overlooking the beautiful, majestic wooded forest in a hot tub. The next they realize they were in boiling water all along and it is too late to escape the pot.
Graphic imagery, yes. But I would submit to you it is wholly appropriate given the deterioration of various asset classes amid the complacency in equities.
And what better reflection of that then the granddaddy index of them all losing its 200-day moving average despite how little actual panic there is, at least for now?


