
19Aug11:41 amEST
Hammerin' the Top
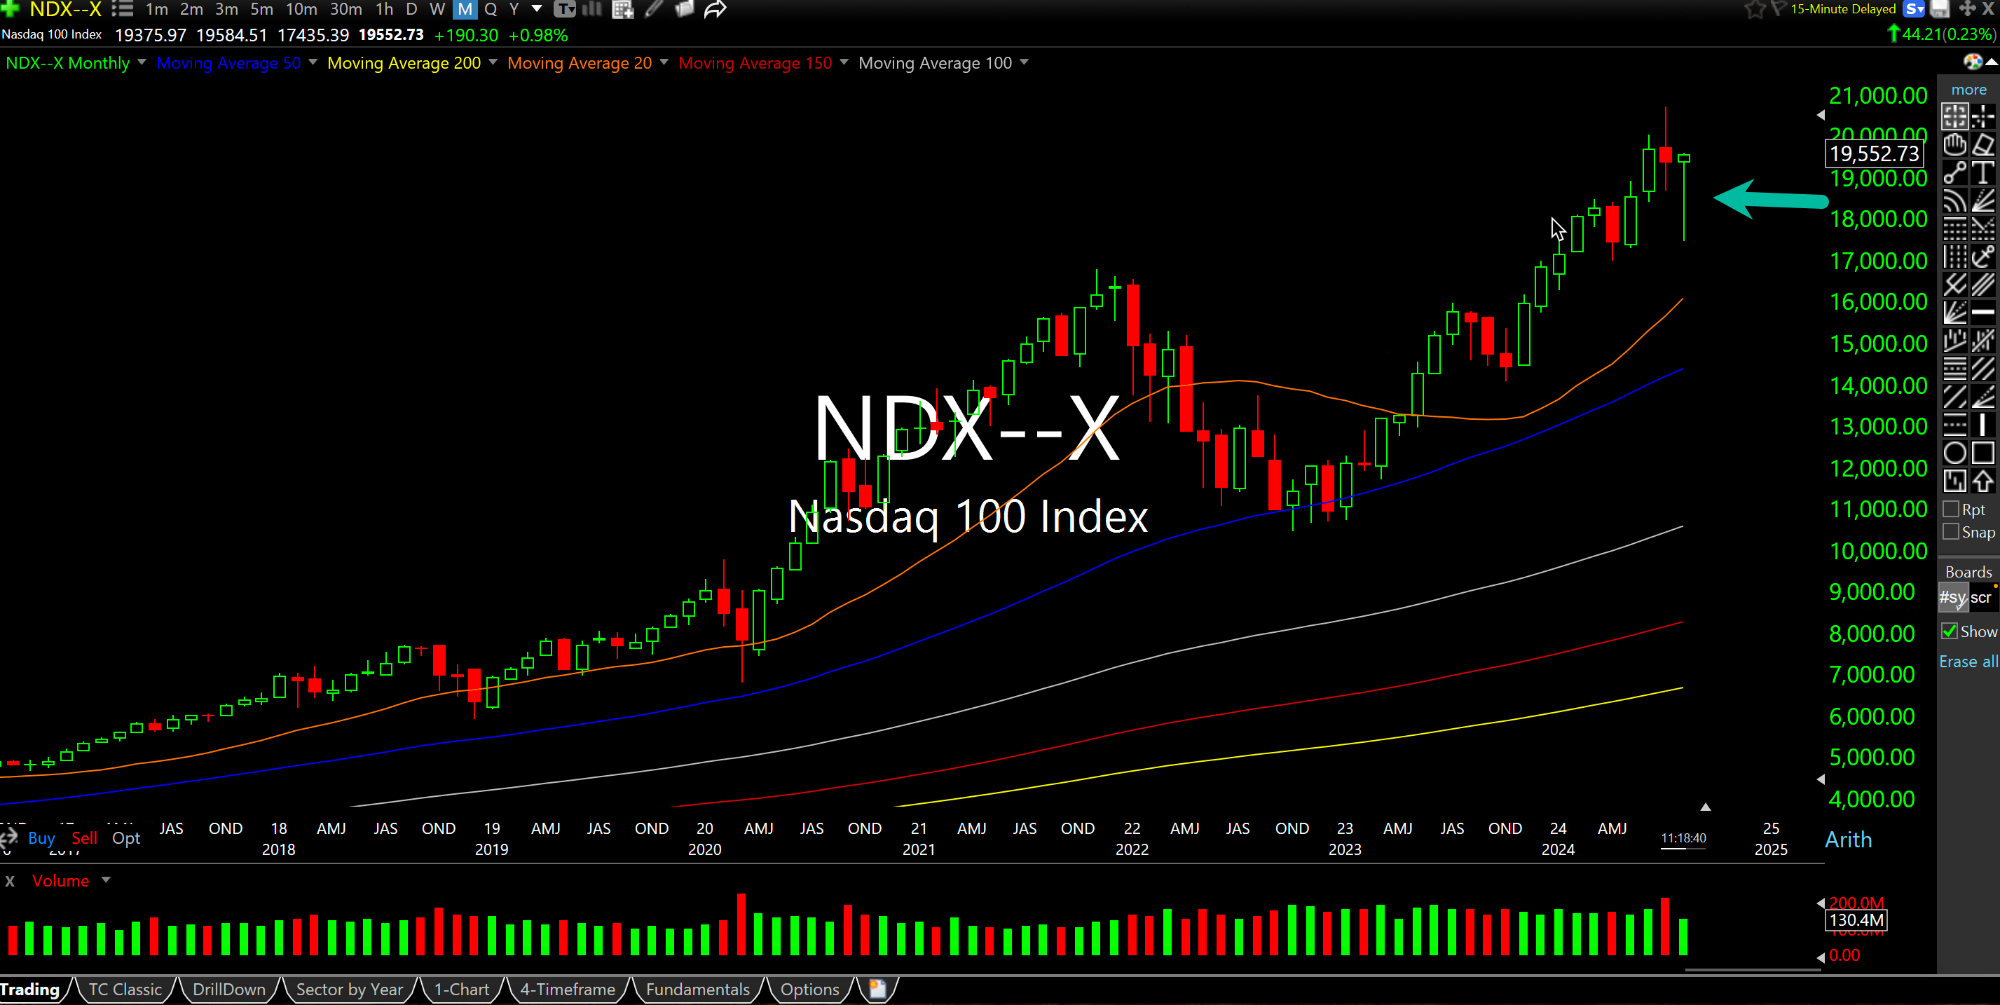
The first monthly chart, below, is of the current Nasdaq-100 Index. The arrow points to the massive candlestick currently forming for the month of August, 2024.
Even with two weeks left of trading before the candlestick is complete we know we will have a massive price range, gauging the sheer size of the candle. As we have been noting here and with Members, massive price swings of this degree after a prior multi-quarter/year/decade melt-up is historically a bearish omen, as it denotes that buyers are slowly but surely losing their grip on the action via a violent struggle.
Put another way, the price swings are the message.
If August closes right around here for the Nasdaq we would be left with a monstrous "hammer"-like candle which, again, given its location/placement after such a steep prior rally, makes it far less of a bullish sign than it would after a prior steep downtrend. So while the exhilarating reversal over the last two weeks has bulls thinking another melt-up to new highs is a lock, there is plenty of market history saying to the contrary.
One prime example can be seen on the second monthly chart, of the Nasdaq-100 from the dot-com bubble at the turn of the century.
Folks love to reference March 2000 as the big dot-com bubble top. And while it was, let us not forget April and May 2000 as example of massive price ranges occurring during a major topping process, which I still believe it was what we witnessing in real-time now.

Afternoon Update 08/16/24 {V... Who Does Number Two Work For...


