
21Apr11:07 amEST
Look at the Symmetry

There is plenty of noise out there right now so let us do our best to keep things simplified.
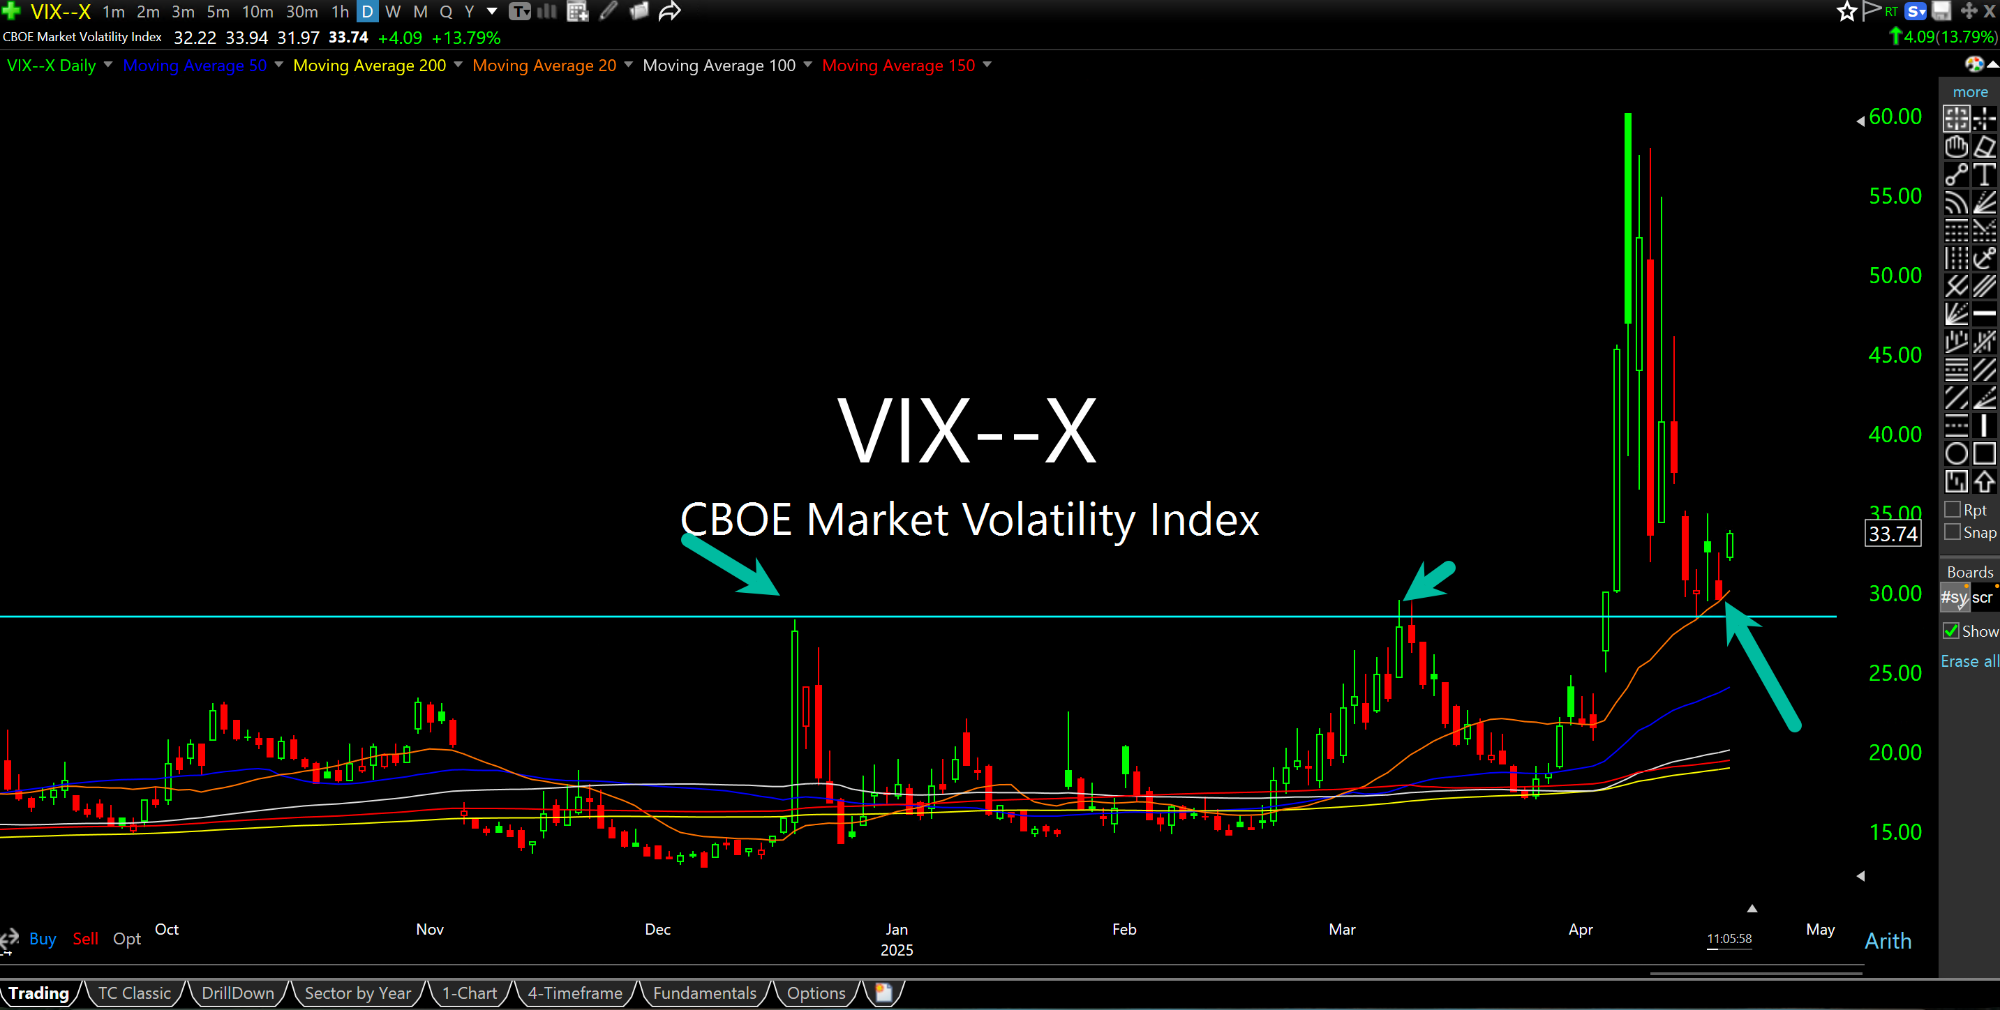
The VIX recently saw another spike like it did last summer and then a sharp giveback, just like it did last late-summer into autumn. It eventually went back into the teens by the holidays late-last year.
This time around, the precise issue for us is whether we see volatility continue to bleed lower or, instead, form a higher low above 20, the latter which likely indicates a notable regime change into a market with higher-for-longer volatility as we often seen in bear markets.
While I am not an advocate of performing complex technical analysis on the VIX (it is several times removed from equities, after all, as it measures action in the options market, which are derived from equities, of course), the VIX daily chart, below, does illustrate the Index finding support in the mid/upper 20s, an area where it hit highs back in late-2024 and earlier this year.
With tons of uncertainty regarding what Trump will do with Powell, tariffs, and just how resilient the economy may or may not be, it truly seems like bulls need this earnings season, with Magnificent 7 names reporting in the coming weeks, to continue to defy gravity and knock the cover off the ball to keep the VIX from surging back higher to cement the new regime in volatility.
Ten Years in the Books for M... I Scream, You Scream, We All...


