
25Jun3:21 pmEST
What You Got Ain't Nothin' New

"What you got ain't nothin' new. This country's hard on people. You can't stop what's coming. It ain't all waiting on you. That's vanity." -No Country for Old Men (2007)
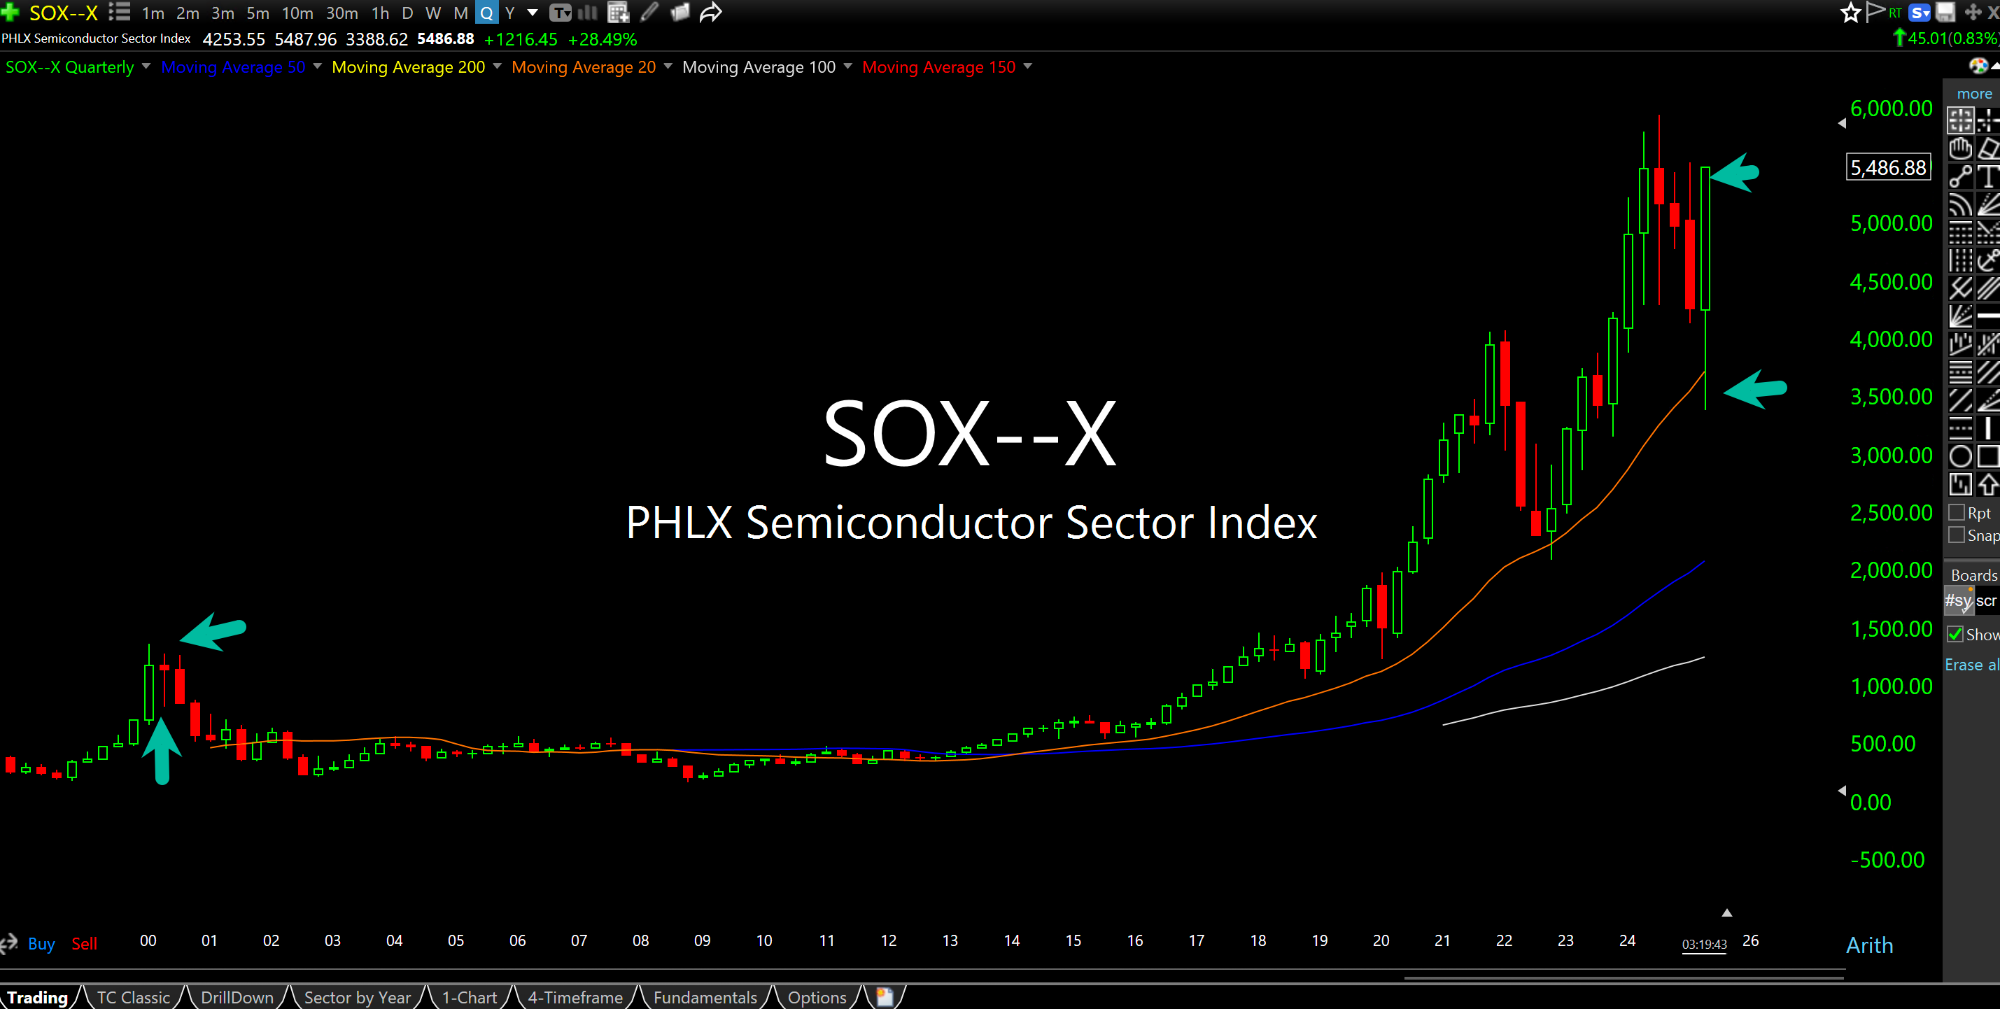
The sheer size of the current quarterly candlestick on many major indices and tech/growth charts is truly something to behold, as illustrated on the current SOX (Philadelphia Semiconductor Index) quarterly chart, below. Sizable candles indicate a loud disagreement taking place between buyers and sellers. And just as in real estate, location is king. Hence. when they occur after an established, steep, multi-decade uptrend, history says we should be on watch for the massive uptrend to slowly begin to crack as buyers are finally unable to hold gains.
MVDA is leading the chips higher today, even as other tech names like PLTR NFLX finally slow down a bit.
The critical issue, as we wind down the second quarter of trading next Monday, is whether you believe this time is different.
In other words, twenty-five years ago during the lengthy dot-com bubble topping process we also had extreme, sizable quarterly candles. They may now seemed dwarfed on the quarterly chart below (lefthand side) but I can assure you in real-time the swings were massive.
Bulls will argue the fundamentals and macro are different now, to which I reply, "Of course." We almost never see exact replicas of prior cycles.
In fact, my view is that the current cycle is a hybrid between the macro of the 1970s as well as elements of both the 1970s stagflation NIFTY FIFTY bust and the dot-come bubble. In either case, you could trade many decades from now and portably not seen quarterly candles of this size on a major sector or index chart, especially after such a steep uptrend.
Stock Market Recap 06/29/15 ... The Mystery of Boxing Shorts...


