02Dec3:05 pmEST
Location, Location, Location

Much like in real estate when we analyze the technicals, specifically candlesticks and patterns in general, we want to hone in on location as a significant factor.
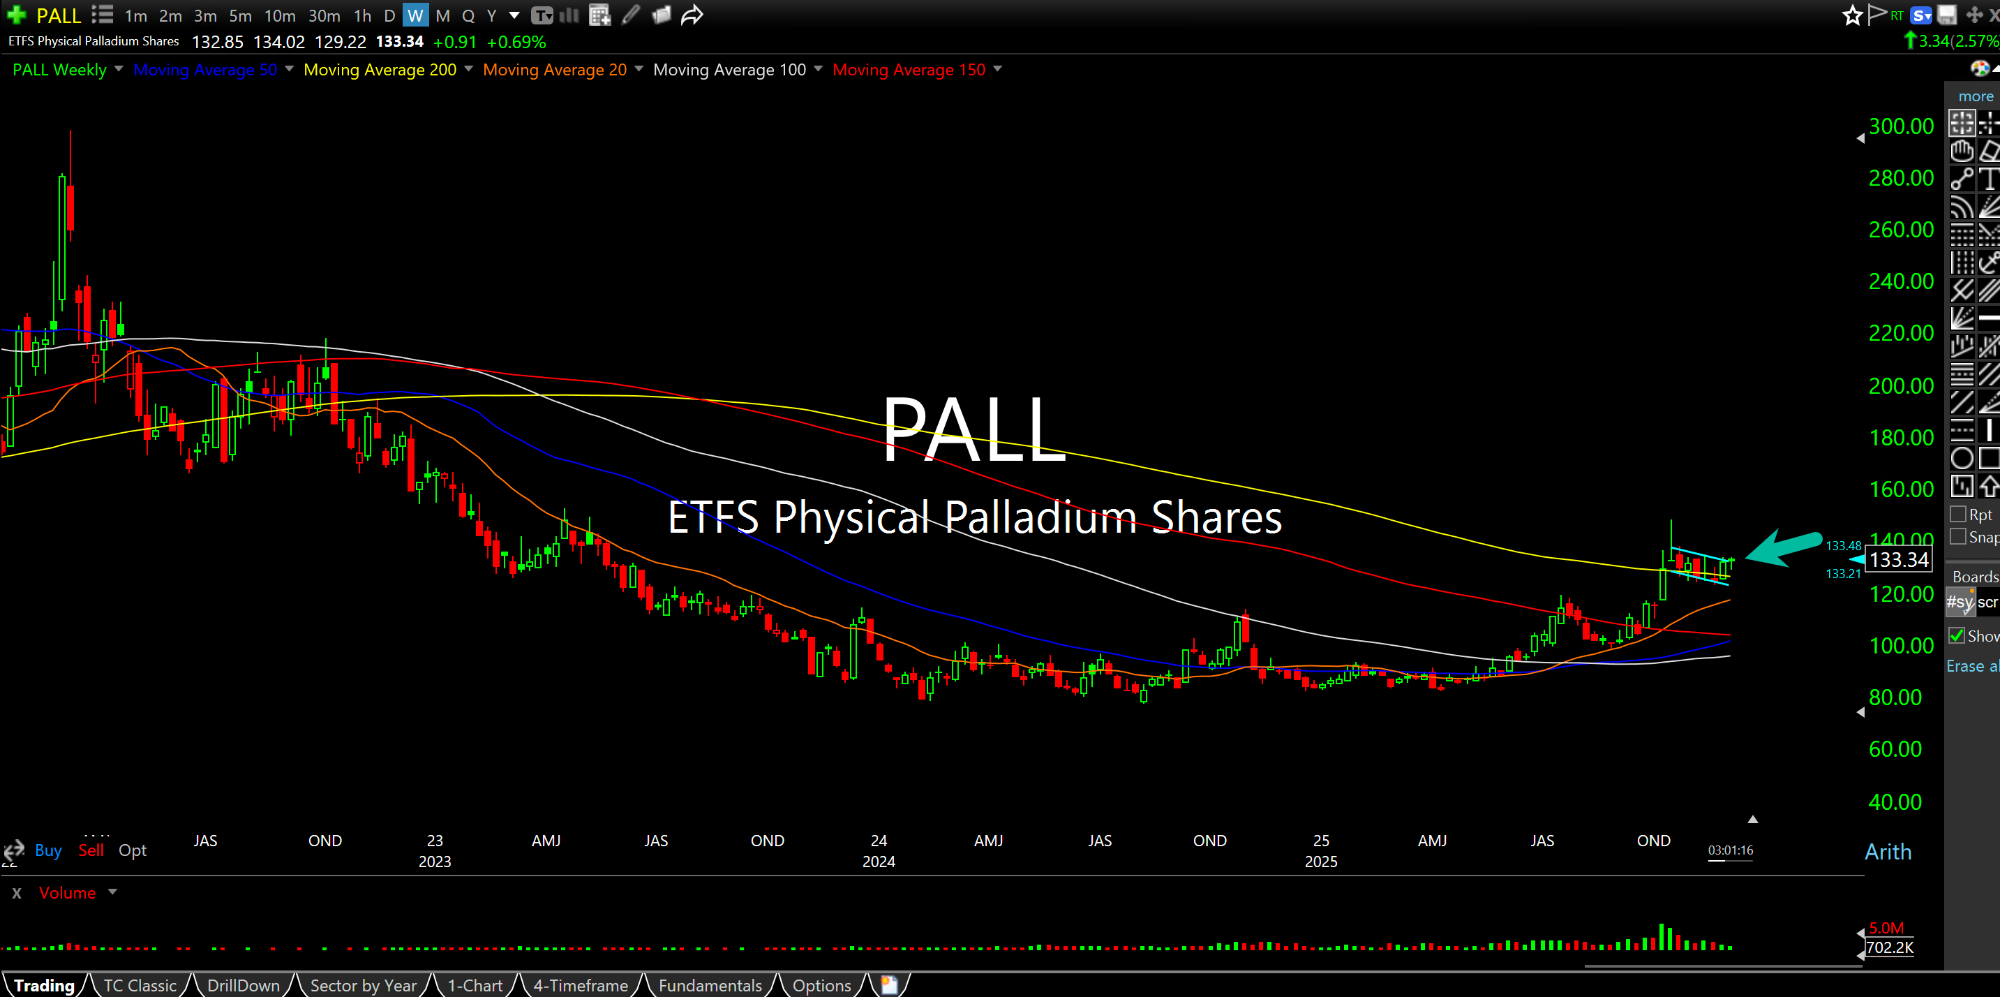
In particular, the first weekly chart, below, for the Palladium precious metal shows us a tight technical sideways base. In and of itself, however, that only tells us part of the story. The more significant analysis comes in when we see that the base is occurring at the 200-period weekly moving average (yellow line) after a prolonged period of Palladium turning in underwhelming price action.
In other words, we are looking at a long-term bear-to-bull reversal in Palladium, which aligns with the strength in the precious metals like gold and silver in recent quarters, to boot. After all, one would expect a formerly bearish chart turning bullish to recapture a long-term significant moving average like the 200-period weekly, or at least become acclimated to it again by not being outright rejected upon visiting it. In this case, Palladium is basing right on it and, likely, forming a launch pad for another leg higher.
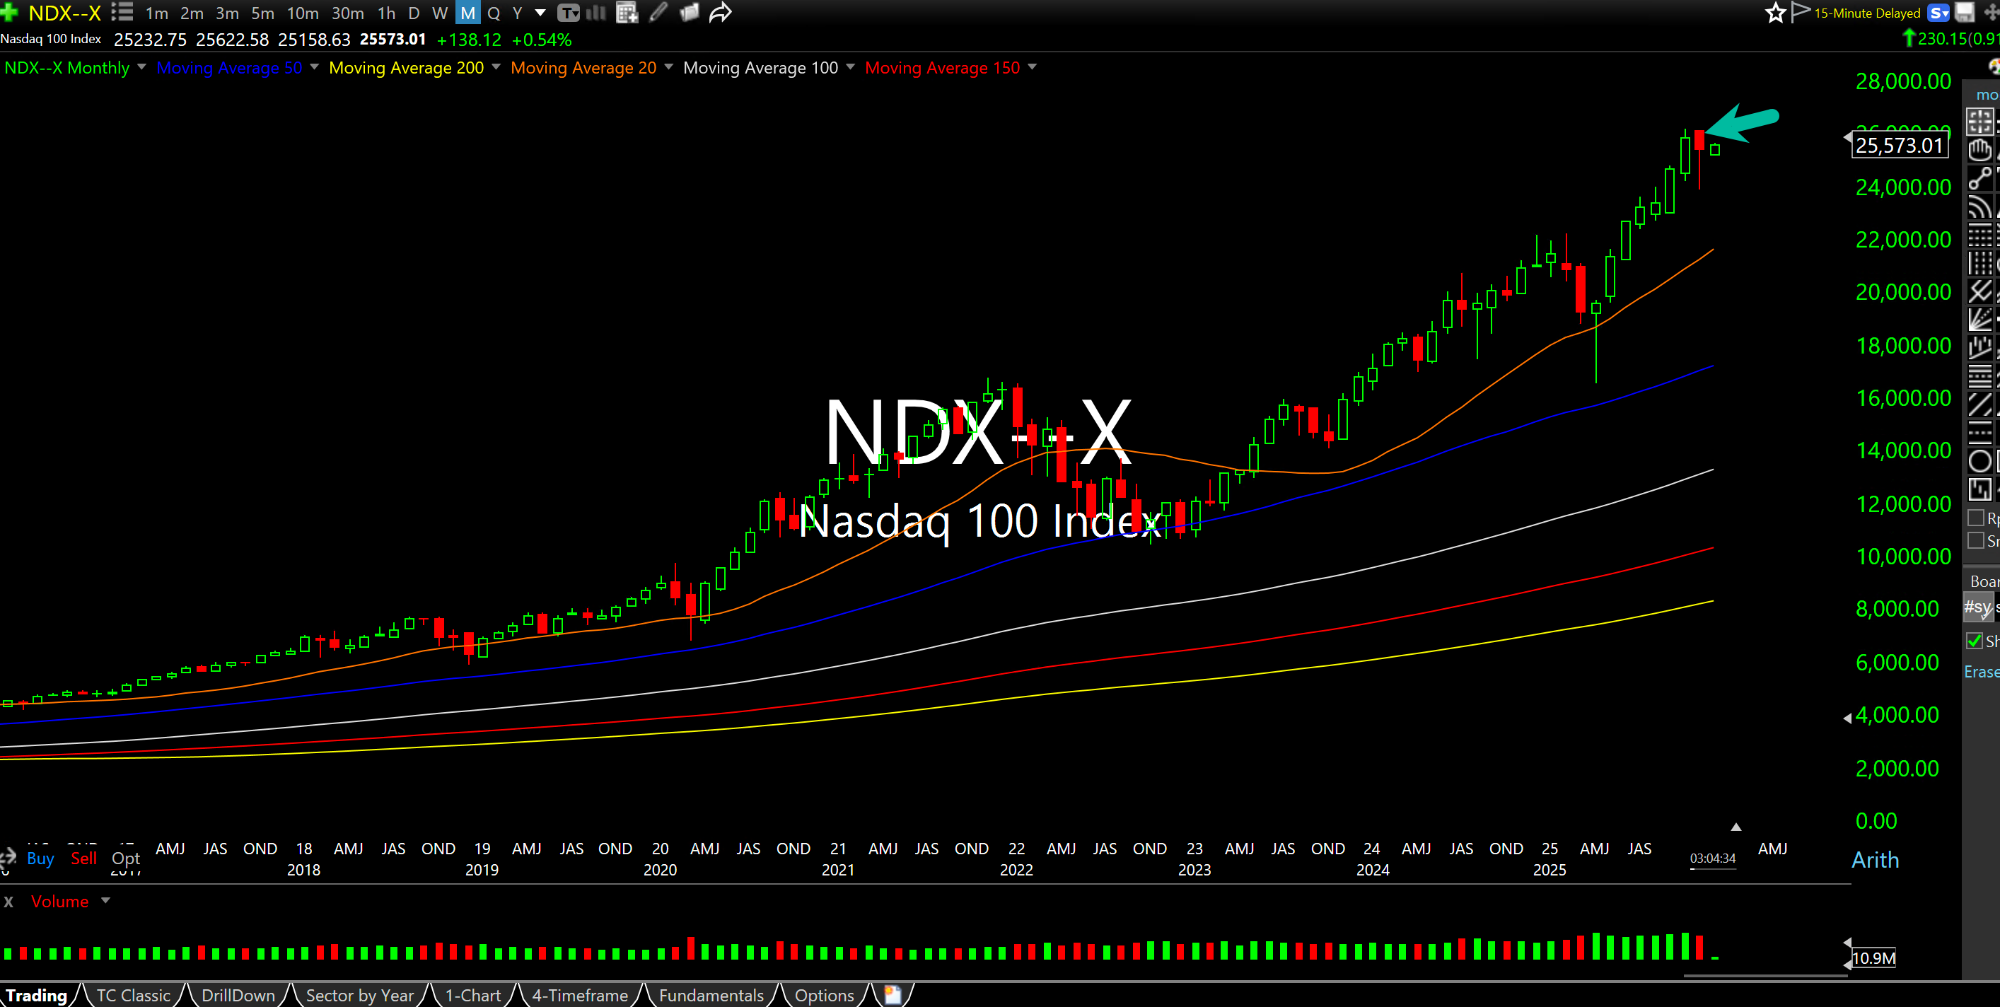
Inversely, the second monthly chart for the Nasdaq-100 Index shows us November's now-competed candle (arrow) is a potential bearish "hanging man" reversal. After a prior downtrend this same candle would be called a bullish "hammer." Alas, location, location, location, since it is now occurring after an epic muti-month winning streak for the index.
That said, the necessary element is confirmation lower in order to cement a bearish reversal, which needs to happen for bears either this month or in early-2026, provided that November's highs are not meaningfully breached.