19Dec2:21 pmEST
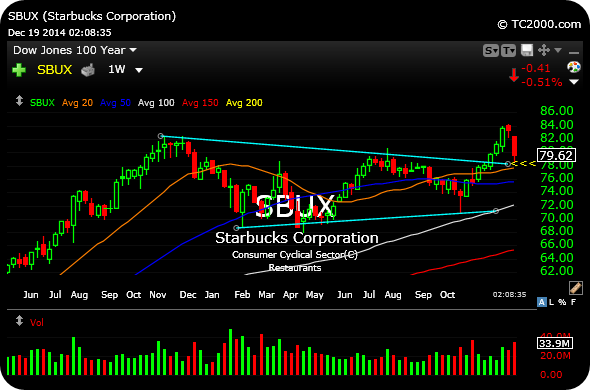
Starbucks Looking to Keep Its Brand Intact
 SBUX is a critical chart in the market headed into next week, insofar as whether this breakout holds in a routine check-back on the weekly chart, first below. A move back under $78 would set up a potential "bull trap," or false breakout. At a minimum, it would yield a squishy chart like we have seen from the financials of late.
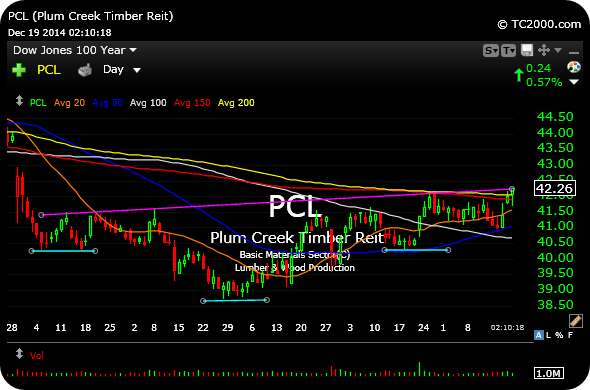
Also note, as my friend @StuOnGold pointed out, PCL on the second daily chart, below, may be cementing a major bottoming formation. I would watch for a weekly close here over $42.16 to confirm it. The pattern projects a move up to $46.


