
23Dec3:36 pmEST
Santa Riding Through Some Smoke in These Markets
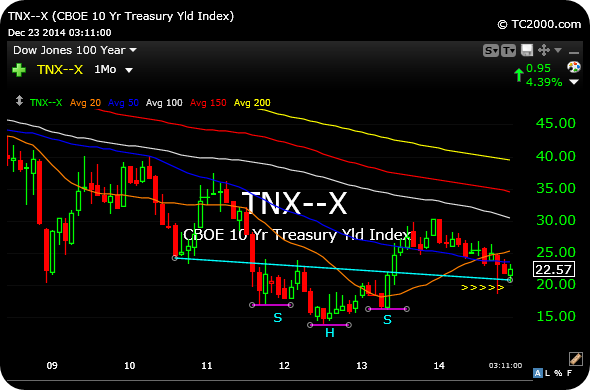
 I present the monthly of the TNX, 10-Year Treasury Yield Index, to illustrate the critical juncture rates are at as we head into 2015.
As we know, bond bulls pulled off a tremendous 2014, largely seeing me hold off on bond shorts until recently. So why continue to look for the bond short?
The answer can be seen in the monthly chart, below. Rates are "checking back" or pulling in to the slanted "neckline" of the confirmed, multi-year inverse head and shoulders bottom put in a few years back. Rates and bond prices are inversely correlated, which means charts like TLT look to be the opposite of the TNX.
Headed into 2015, I am looking for bond bears to reassert themselves, which means this chart below would move higher to push rates up. At a minimum, a well-defined stop-loss can be seen if the extended neckline is breached, say, below 20.
More on bonds and the hot topic of the day, biotech, and ACHN GILD, in my video market recap after the bell.
I present the monthly of the TNX, 10-Year Treasury Yield Index, to illustrate the critical juncture rates are at as we head into 2015.
As we know, bond bulls pulled off a tremendous 2014, largely seeing me hold off on bond shorts until recently. So why continue to look for the bond short?
The answer can be seen in the monthly chart, below. Rates are "checking back" or pulling in to the slanted "neckline" of the confirmed, multi-year inverse head and shoulders bottom put in a few years back. Rates and bond prices are inversely correlated, which means charts like TLT look to be the opposite of the TNX.
Headed into 2015, I am looking for bond bears to reassert themselves, which means this chart below would move higher to push rates up. At a minimum, a well-defined stop-loss can be seen if the extended neckline is breached, say, below 20.
More on bonds and the hot topic of the day, biotech, and ACHN GILD, in my video market recap after the bell.
Aligning for a Snapback Rall... Stock Market Recap 12/23/14 ...


