
04Jan11:16 amEST
A Sunday Morning Sight to Ponder
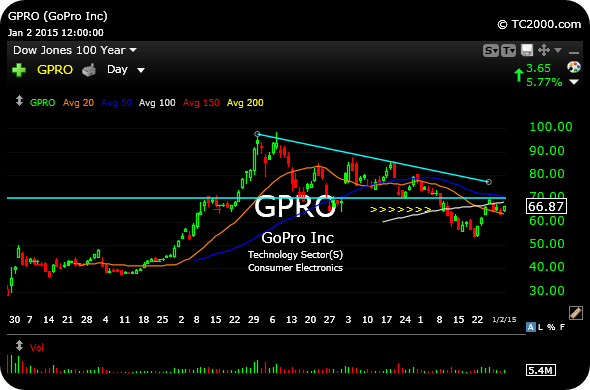
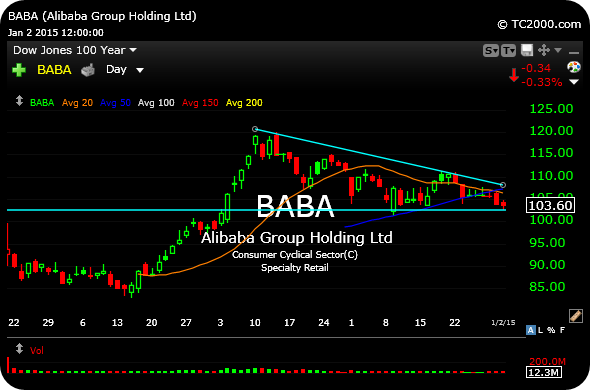
 I present the daily charts for recent-IPOs GPRO and BABA, respectively below, to illustrate how similar they look. Specifically, BABA looks just like GPRO did before a sharp breakdown in mid-December.
Note the comparable descending triangles I have highlighted on each chart, with a series of lower swing highs (resistance, upper light blue line which is downsloping), against well-defined support (lower light blue line, horizontal). Typically, the selling pressure builds with the lower highs against the support, leading to the breakdown.
BABA is a name which has been a sexy long pick for bulls headed into 2015. I suspected too many eyes were on it in the past week or two for it to break much higher. But a short-term washout, similar to GPRO, may very well be the real risk here.
I present the daily charts for recent-IPOs GPRO and BABA, respectively below, to illustrate how similar they look. Specifically, BABA looks just like GPRO did before a sharp breakdown in mid-December.
Note the comparable descending triangles I have highlighted on each chart, with a series of lower swing highs (resistance, upper light blue line which is downsloping), against well-defined support (lower light blue line, horizontal). Typically, the selling pressure builds with the lower highs against the support, leading to the breakdown.
BABA is a name which has been a sexy long pick for bulls headed into 2015. I suspected too many eyes were on it in the past week or two for it to break much higher. But a short-term washout, similar to GPRO, may very well be the real risk here.
Saturday Night at Market Che... Weekend Market Film Session ...


