13Mar2:01 pmEST
A Look Across Multiple Timeframes for Lumber Liquidators
As I mentioned in recent video market recaps, although it is tempting to play for a big, contrarian bottom with a widely-disucssed swoon for both the stock and company's reputation, the idea was to resist the urge to play LL for anything more than a quick long scalp.
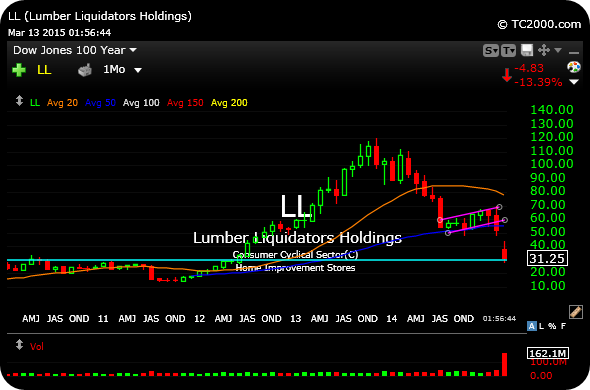
On the monthly chart, first below, the best case bulls can make is that the recent plunge has quickly taken price back down to prior resistance, from 2010-2012 in the $30 area. That bull case would see that former long-term resistance now converting into major support to buttress this fall.
Nonetheless, that is a dangerous assumption to make, given the headline velocity the company has seen of late, with perhaps more coming soon.
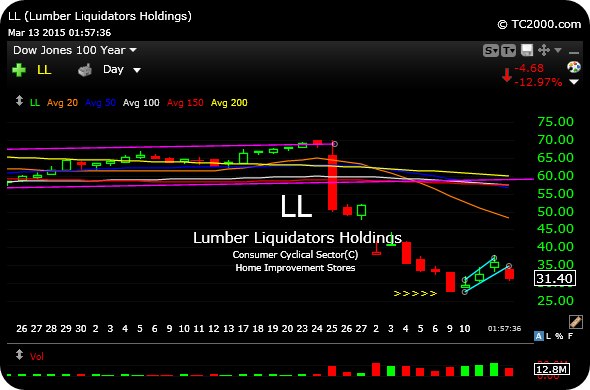
In addition, pure technical momentum is to the downside, as evidenced by the second daily chart. Note the bear flag discussed on last night's video breaking down today.
Simply put, risk still remains lower for LL and longs should probably be of the day-trading variety for now.


