25Aug2:15 pmEST
Top or Bottom

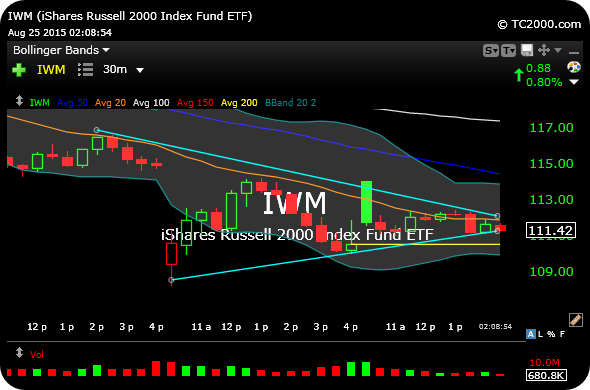
While daily timeframe analysis of the major indices will likely take some time to play out, the 30-minute chart of the small caps in the Russell 2000 Index ETF, below, show price at the apex of the triangle consolidation since last Friday.
We are looking to see if a breakdown materializes, after small caps have been lagging the Nasdaq rally all day today, which implies potential to retest Monday morning's lows.
As a general rule, the more price lingers at the apex of a triangle, the more the edge goes to bears for the breakdown, as too much buying power is being sucked out of the market just to keep the triangle afloat.


