
01Sep10:28 amEST
So Easy, Even a Non-HFT (Human) Can Do It
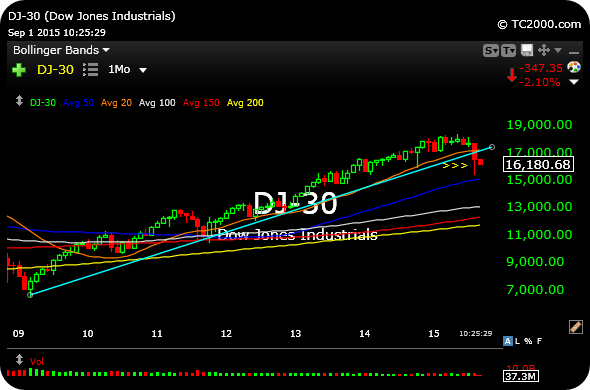
To gain a "forest for the trees" perspective on the current market setup, consider the monthly chart of the Dow Jones Industrial Average, below.
The very rudimentary, so-easy-even-a-non-HFT-can-do-it support trendline (light blue) dates back to the March 2009 bear market bottom, when the Dow was printing below 6,500.
In August, the Dow finally broke that six-year trend.
Now, breaking a well-defined trendline need not mean a complete reversal of the trend. But it does certainly cast aspersions on the idea of a healthy bull still fully intact and imminently heading higher.
What we are looking to see, initially, is whether bounce attempts back over the trendline, over 17,000 or so, are rejected. That, of course, would add credence to the bear care for a more durable change in overarching trend. The 2007 scenario involves a marginal new high by early-October, likely a "max pain" scenario for many market players at this point (but perhaps only max pain after a further drop from here, first).
At any rate, this Dow monthly is a well-defined, broad reference for the market at-large, in many respects.
Stock Market Recap 08/31/15 ... Crude, Where's My Higher Low...


