07Oct12:41 pmEST
Lining Up for the Same Shot

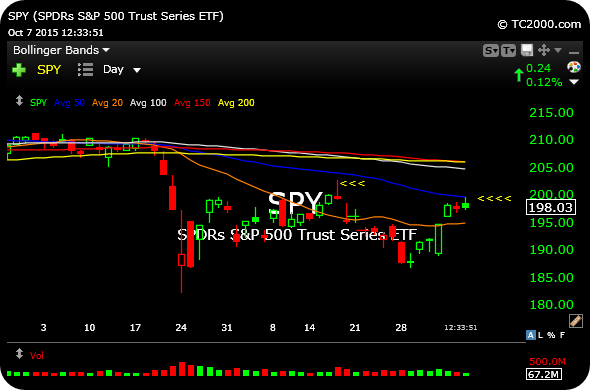
It may seem a bit too obvious, but the S&P 500 Index is reversing roughly where it did back on the FOMC reversal day on September 17th.
On the daily chart of the S&P ETF, below, note the arrows pointing toward the prior an current examples.
With several hours left to go in today's session, and biotechnology stocks staging a sharp reversal off their lows, buyers may very well recapture the initiative after the fade from the declining 50-day moving average (dark blue line) this morning.
However, the weakness in Nasdaq growth leaders like AMZN CMG FB GOOGL NFLX TSLA UA is creeping up again for the second day in a row.
I suspect market players realize there is a lot on the line here, with the first test of the 50-day simple moving average since August 19th playing out as we speak.
I will relay the price action in equites with other markets to make sense of the setup for Members in my usual Midday Video.


