
08Oct2:54 pmEST
See the Wilshire for the Trees

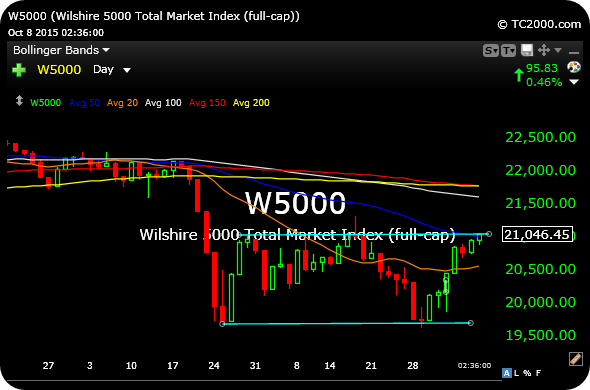
Considering how easy it would be to cherry-pick some of the many divergences and crosscurrents equity markets are currently featuring, let's stay objective and zoom out with the Wilshire 5000 Total Market Index, a market-capitalization-weighted index of the market value of all stocks actively traded in the United States.
On the daily chart of the Wilshire, below, we can see price back over the 50-day moving average (dark blue line), which is sure to garner a good amount of attention tonight if we go ahead and close above it.
But the slope of that 50-day is still declining, which often trumps whether price is marginally above or below it. And that means rallies are still to be viewed with a skeptical eye, even if it is still correct to be patient and hold off on trying to top-tick them. You can also see the market yet to leave the prior highs from late-August (post-swoon) and September in the dust.
Of course, seeing laggards like TWTR can be promising, on top of the sharp bounces in many commodity and energy stocks in front of the symbolic AA earnings report tonight. In addition. NFLX is punishing shorts with a vicious upside reversal as we speak.
But the Wilshire does compel us to still take this market bounce one session at a time, as not much of the technical damage sustained over the summer has been healed, just yet.
Read Up on Prior Commodity B... Stock Market Recap 10/08/15 ...


