24Oct1:19 pmEST
A Classic Look

It may seem as though the fade off the morning highs on the S&P 500 Index is a case of "here we go again!"
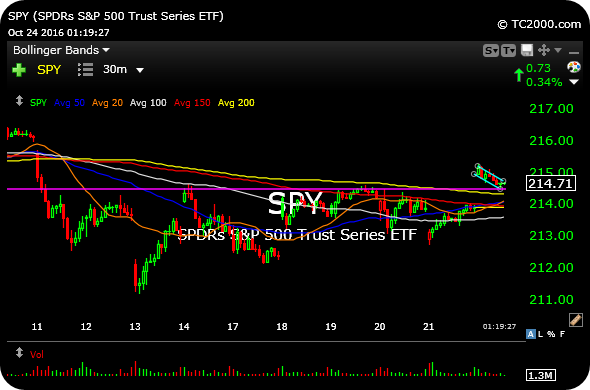
But when we observe the 30-minute chart for the S&P's ETF, below, note the fairly orderly pullback (light blue lines) down to prior resistance (purple line). This presents an excellent test for dip-buyers the rest of the session to avoid a sloppy close and, in fact, put bears in a tough spot regarding whether to hang onto shorts with some near-term resistance now converting into support.
The 2145-2150 area on the S&P 500 cash has been an area we have been noting for a while as being a meaningful initial level for bulls to reclaim. And we have seen nothing yet to disprove that working thesis.
Of course, earnings season is a wildcard, especially this action-packed week. UA looks ripe for a major breakdown but reports tomorrow morning, for example. And GRUB looks great to the upside but also reports soon.
More in my usual Midday Video for Members.