03Jan2:02 pmEST
Genes Leading the Way

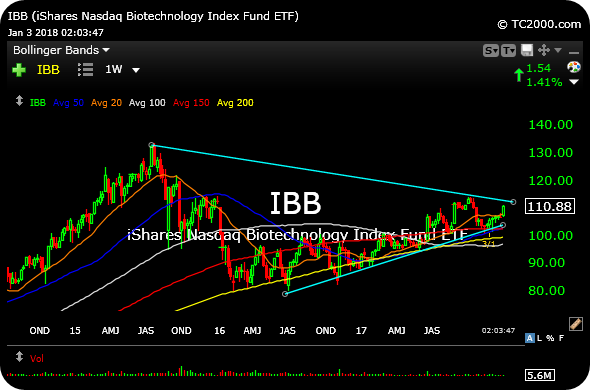
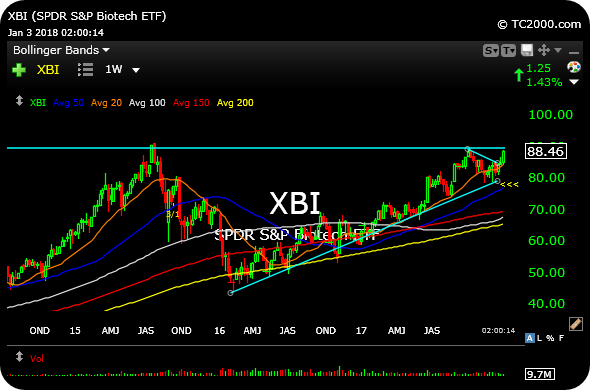
From a long-term perspective, it is interesting to compare and contrast two weekly charts for IBB (ETF for larger cap biotechnology stocks) and XBI (ETF for smaller/mid-cap biotechs), respectively below.
The main aspect which stands out about these two charts is that the XBI is clearly well ahead of IBB. Indeed, when the smaller cap names in a given sector zoom ahead of their large cap brethren it is often seen as a bullish sign of thriving risk appetite--After all, market players are seeking out strong growth in lieu of well-established brand names. Bears may counter that this analysis is overblown, over perhaps indicates reckless risk appetite.
But the reality is that the XBI now threatening a fresh breakout above the 2015 highs from which the entire biotech sector had basically topped and then endured a rough, multi-quarter correction.
In other words, this is now a major, not minor, price area mid-cap bios as they perk up together and basically ignored the small caps as a whole (IWM) hugging the flatline all session.
If bulls can now sustain a fresh breakout above those 2015 highs, after backing off the $90 area in October 2017 on the XBI, it is hard to be bearish, especially with the looming prospect of M&A in the sector. The gene therapy plays come to mind as obvious candidates, namely EDIT.
But there are plenty of other mid-cap bios we are watching for Members which seem to be well worth the typical biotech risk when we consider the technical juncture the XBI weekly chart finds itself in, knocking on the door for an early-2018 breakout.