
09May10:44 amEST
A Funny Thing Happened on the Way to the Energy Selloff Yesterday...

Yesterday's price action in the face of what many complacently assumed would be a slam-dunk energy sector selloff in the face of Trump pulling the U.S. out of the Iran pact is a good example of why we use charts to guide us. Mind you, we are not proponents of the idea that technical analysis ought to be used to constantly make bold, directional calls for any and all markets.
Instead, we use the price action and volume patterns (and accompanying indicators derived from price and volume) to help interpret the price action as objectively as we can.
And when we do that, we can see that the energy sector ETFs, namely the high beta XOP, had every reason to acquiesce to the bear case and come in hard. But any dip was short-lived, as bulls reasserted themselves and effectively trapped in overzealous bears.
Simply put, energy stocks, as frustrating as they have been for longs for a good while now, continue to act as well as they have in years. As the sector improves, so too does our bias to stay constructive with the newfound bulls' success.
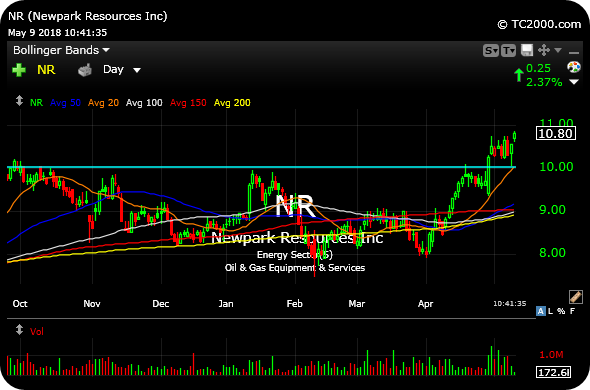
One example of a name we are rather bullish on is Newpark Resources, below on the daily chart. Again, with every reason to sell off on news flow and hopeful bears piling in, NR held above its prior breakout level and now threatens a fresh leg higher.
Also note that when we look down the line as long-time laggards, such as CHK RRC SWN, even they are showing life this week and could easily be reinforcing the notion of a new energy bull underway.
Combining oil stocks with the uranium and coal resurgence has us consistently looking at the entire complex for long setups on a daily basis now.
Stock Market Recap 05/08/18 ... Small Caps Outperform...Grea...


