
23Oct2:16 pmEST
Appreciate the Full View

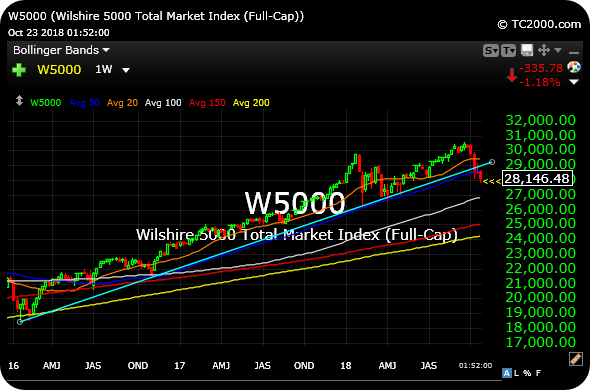
The Wilshire 5000 Total Market Index, below on the weekly timeframe, measures performance of all U.S. equity securities with readily available price data. In other words, the Wilshire arguably gives the ultimate birds-eye view of the market at any given time.
Despite the bounce off session lows today, which is holding so far, it is worth noting that the Wilshire has definitively lost is major support trend-line (light blue line). The trend stretches back to the beginning of 2016, when many believe the latest bull run commenced. Until that broken support is regained, it is likely correct to assume the market remains in a near-term downtrend until proven otherwise.
Moreover, the likes of MCD and WMT are notably outperforming with firm charts, inductive of a flight to safety in those two mega cap all-American brands.
Sink or Swim Mentality for a... Stock Market Recap 10/23/18 ...


