25Mar3:18 pmEST
It Defeats Its Own Purpose

Working our way through the final hour of a much slower, more mixed session than some of the one-way bullet trains up and down we saw last week, it is worth making another observation regarding the significant Russell 2000 Index.
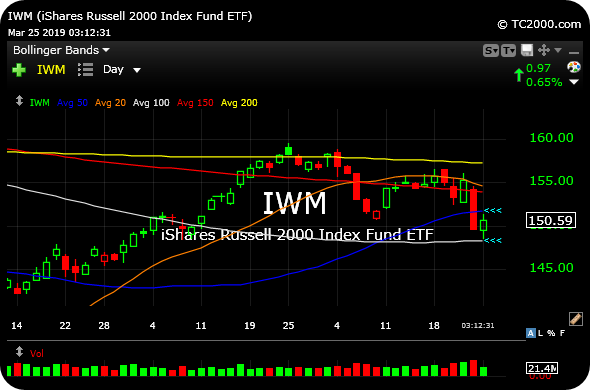
On the updated IWM daily chart, below, which is the Russell's actively-traded ETF, we can see price trapped in a moving average "sandwich." It is fairly obvious to casual chart watchers that the 50-day moving average (dark blue line) is just above spot price. We noted with Members earlier that bulls need to get back above the 50-day at a bare minimum to try to reignite upside momentum.
But just below spot price is the often-overlooked 100-day moving average. When a moving average is obvious and widely-watched, such as when the major averages test their respective 200-day moving averages, even non-technicians tend to sneak in a peek to see how price reacts, if at all. If anything, that obvious nature may defeat its own purpose, since the market likes to fool the majority and thus we often see shakeouts and head-fakes around obvious spots like the 200-day.
But the 100-day (the gray-ish line) is the type of reference point which even most chartists do not focus on too much. And, yet, that may prove to be even more valuable in our analysis, since fewer eyes are glued to it.
As a result, with the IWM I view this 100-day moving average test, holding for now, as a place where buyers had better defend to prevent follow-through of last Friday's bloodbath.