
03May1:58 pmEST
Attention to Detail

In lieu of harping on the "big things" this week, be it The Fed perhaps not being dovish enough, some mixed economic data, GOOGL pounded after earnings but AAPL faring quite well, all the while Warren Buffett takin a (root beer) floater via shares on AMZN, among a plethora of political headlines, we instead wanted to stay tangible, if you will.
In other words, our focus for Members was on using any information the market gave us to our advantage.
During market consolidations or pullbacks, no matter how long or deep they are, oftentimes the market will give away a few "tells," some of which are fairly obvious and some of which are subtle to active market players and observers alike.
And with respect to the small caps housed in the IWM, ETF for the Russell 2000 Index, we knew we had to keep a close eye on them for a few reasons. First and foremost, the senior indices (Dow, Nasdaq, S&P) could afford to come in quite a bit and would still not suffer any real technical damage--After all, the DIA QQQ SPY were all cleanly above their major daily chart moving average given their sharp rallies since Christmas.
The IWM, however, had only recently reclaimed its 200-day moving average and was not really in a position to fool around much with a giveback into a market dip. In fact, a clear risk to not just the small caps but perhaps by proxy to the broad market is that we would see IWM abruptly roll back over and begin to wreak havoc on larger cap names in terms of a regime change tilted towards a risk-off environment.
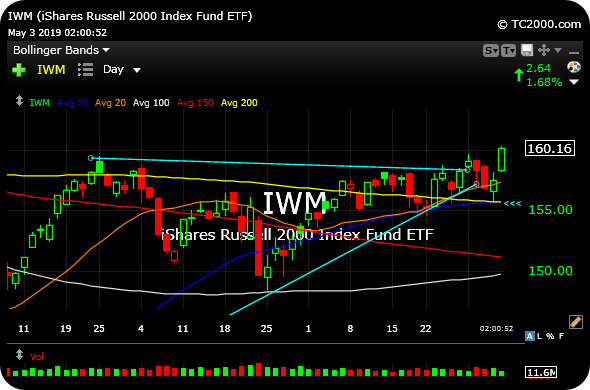
At yesterday's session lows, not long before I filmed a Midday Video for Members, I noted that the precise, exact low for the IWM was at $155.68, which happened to, unbelievably, coincide with the 200-day moving average. As you can see on the updated IWM daily chart, below, the small caps were suddenly at a critical juncture, rendering the massive triangle setup highlighted light blue a possible failure back below $155.68, or instead sporting a final shakeout before we then ripped higher.
When the IWM closed strongly yesterday, it gave bulls hope for a bullish divergence provided that the jobs number did not outweigh this technical progress. As we are seeing so far today, pending a decent weekly close in a few hours, that IWM divergence is proving true for bulls and opens the door for a fresh breakout on longer-term timeframes.
The $159.50 level was an upside resistance area we have been flagging for a while. And as long as we close above that today it should buy bulls some breathing room after a hectic few weeks for the market digest an awful lot of macro and micro data.
Beyond Meat: Ingredients for... Saturday Night at Market Che...


