10Mar10:59 amEST
Gap and Go Figure

It is always a fascinating exercise to overlay a chart of the broad market undergoing a correction, as we are now, against the prevailing sentiment of any given gap higher.
In this case, the opening gap higher this morning on the back of a limit-up futures session overnight has given bulls plenty of renewed hope and relief that President Trump's intended payroll tax cuts and small business loans will be just enough to bottom out this recent swoon.
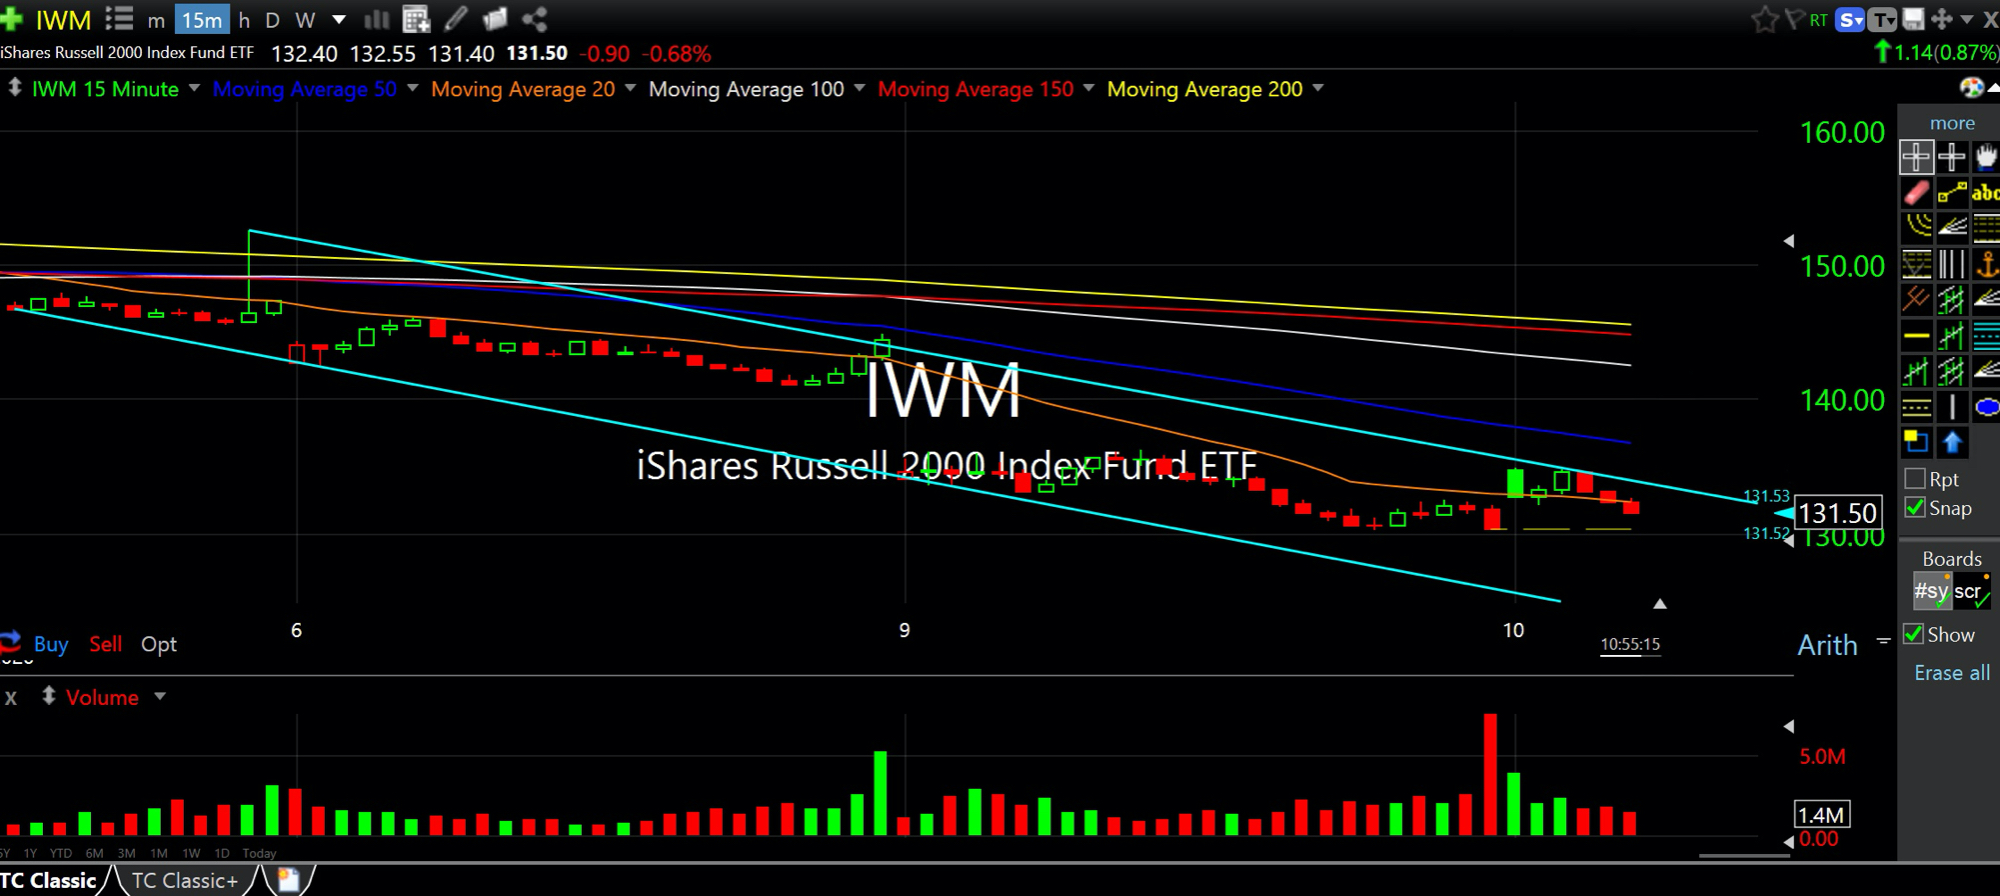
However, gauging the updated 15-minute chart for the small cap-dominated IWM (ETF for the Russell 2000 Index), below, we can see the technical evidence for a bottom remains sparse. Even on this near-term timeframe, dating back to late-last week, this morning's gap higher has done nothing to reverse the falling channel I have highlighted in light blue. Failing to recover $135 today would be problematic, too, as it would indicate that the intraday highs from yesterday and this morning were too stout to surpass in terms of resistance.
Beyond that, names at the epicenter of recent headlines, like CCL (cruise line, re: virus) and SLB (energy crashing) are both flat or even red as I write this, which does not seem like the sort of action we would see out of them at a market bottom.
While sentiment measure began to hit extremes to the negative yesterday, an encouraging sign indeed, I suspect the uniquely sloppy manner in which this market has been acting and the velocity of the downdraft in recent weeks means that the healing process will be much more tedious and irritating to most traders than they expect, even if we do bottom soon.
Hence, my focus is still on preserving capital while refining a running list of superior charts exuding unique relative strength during this period, such as EVBG.

Midday Analysis 03/09/20 {Vi... Stock Market Recap 03/10/20 ...


