
15Apr11:26 amEST
Masks Covering a Fierce Rivalry

You might be wondering just how much longer we can see trading sessions where the premier names in the Nasdaq, notably Amazon, can exude such impressive relative and absolute strength even as small caps, banks, energy, insurers, REITs, among other weak parts of the market, can keep suffering bloody selloffs.
In early 2008, however, many bears were also quite frustrated albeit with different sectors exuding relative strength back then. We had the agriculture and energy/materials making fresh highs on a daily basis with names like FCX, Potash, SLB, solars and steels giving the impressive of a rotation into inflation plays and keeping debt deflation bears largely frustrated for a chunk of the first half of that year.
Of course, that inflationary move turned out to be a head-fake, with pricing pressure actually expediting the deflationary crash later that year.
Still, the point remains that these cycles often take time to play out and truly test your patience.
Can AMZN NFLX TSLA ZM offset the very real and ominous technical damage in the banks and small caps, for example? Naturally, the answer depends on your overall view: Bulls will expect the Nasdaq to hold the line for now and eventually look for rotation down to laggards at some point, while bears will most certainly look for a 2008-esque unwind of everything in the coming months.
So perhaps the best strategy is to press shorts on the weaker names and stick to relative strength for the longs, as both the bull and bear case in these situations have a history of taking longer to play out than we think before we truly see the rubber meeting the road for one side to claim victory over equities as a whole.
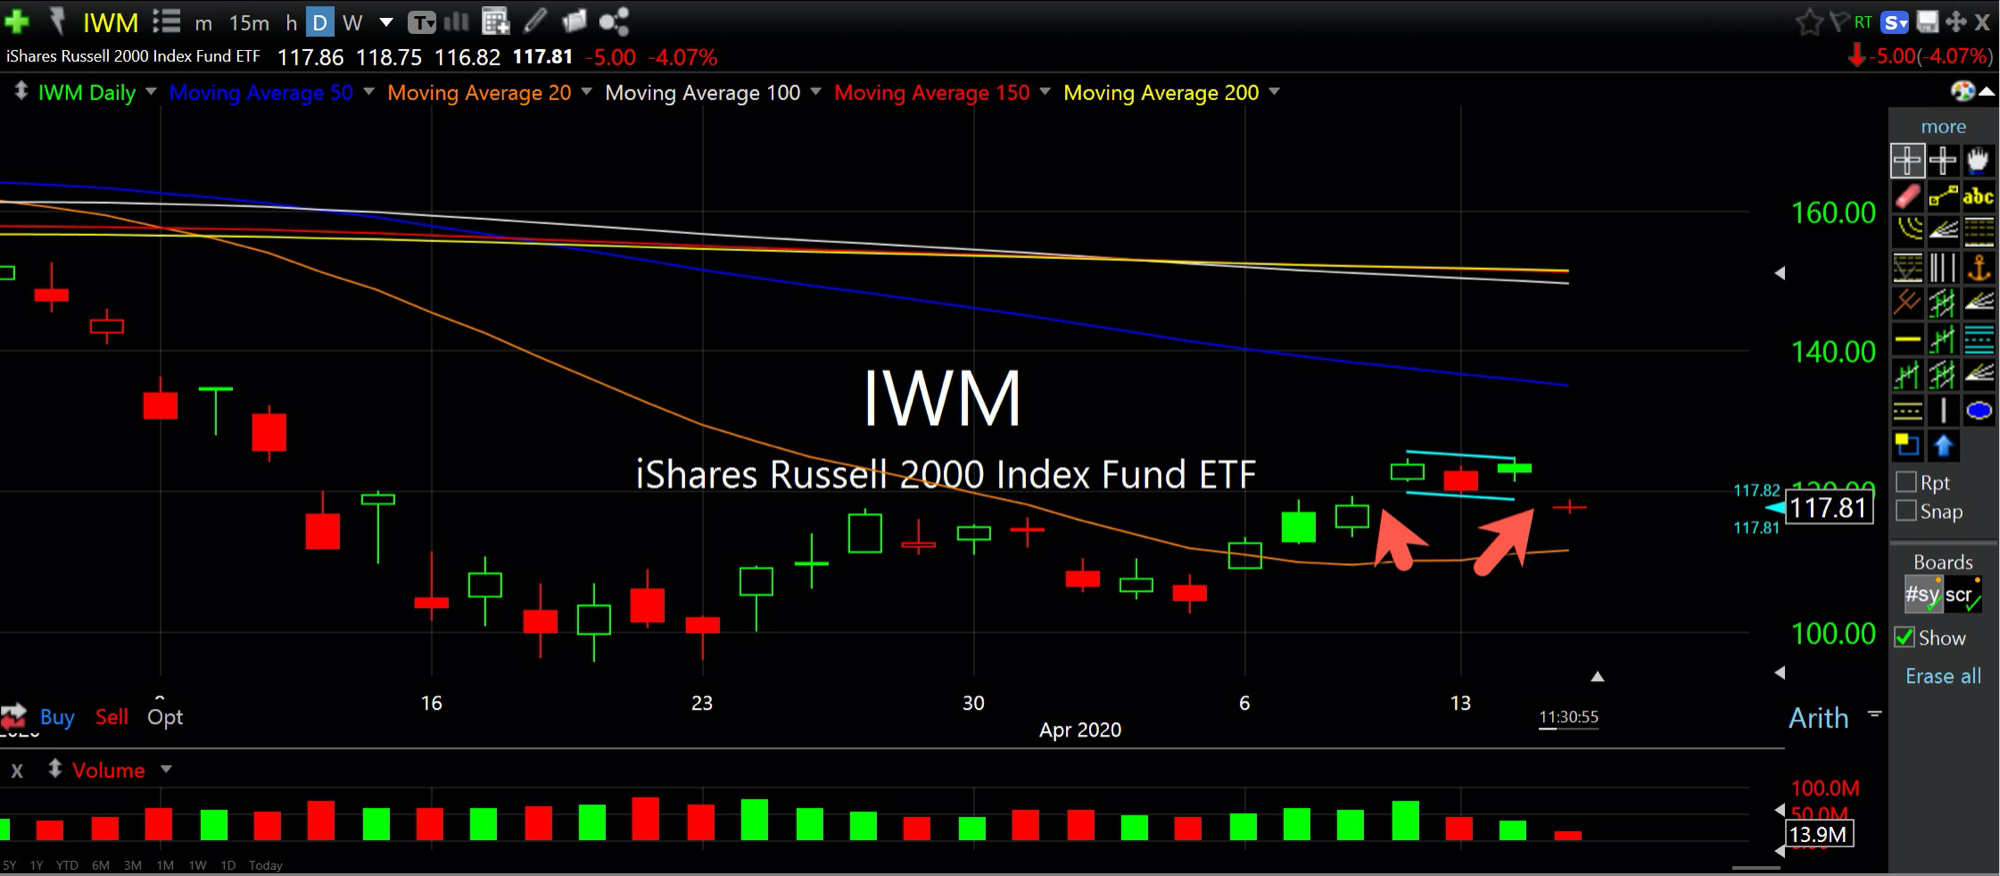
With the IWM down by more than 4% as I write this, the small cap stocks are in grave danger of confirming a bearish "island" reversal pattern after the recent relief rally.
On the updated IWM daily chart, below, holding under $118 or so should pressure recent longs, as the highlighted cluster of candles with gaps on either side (arrows) creates the island leaving bulls who had assume we were done going down now effectively trapped.
It'll Do till the Mess Gets ... Stock Market Recap 04/15/20 ...


