25Apr9:05 pmEST
Saturday Night Chart for Thought

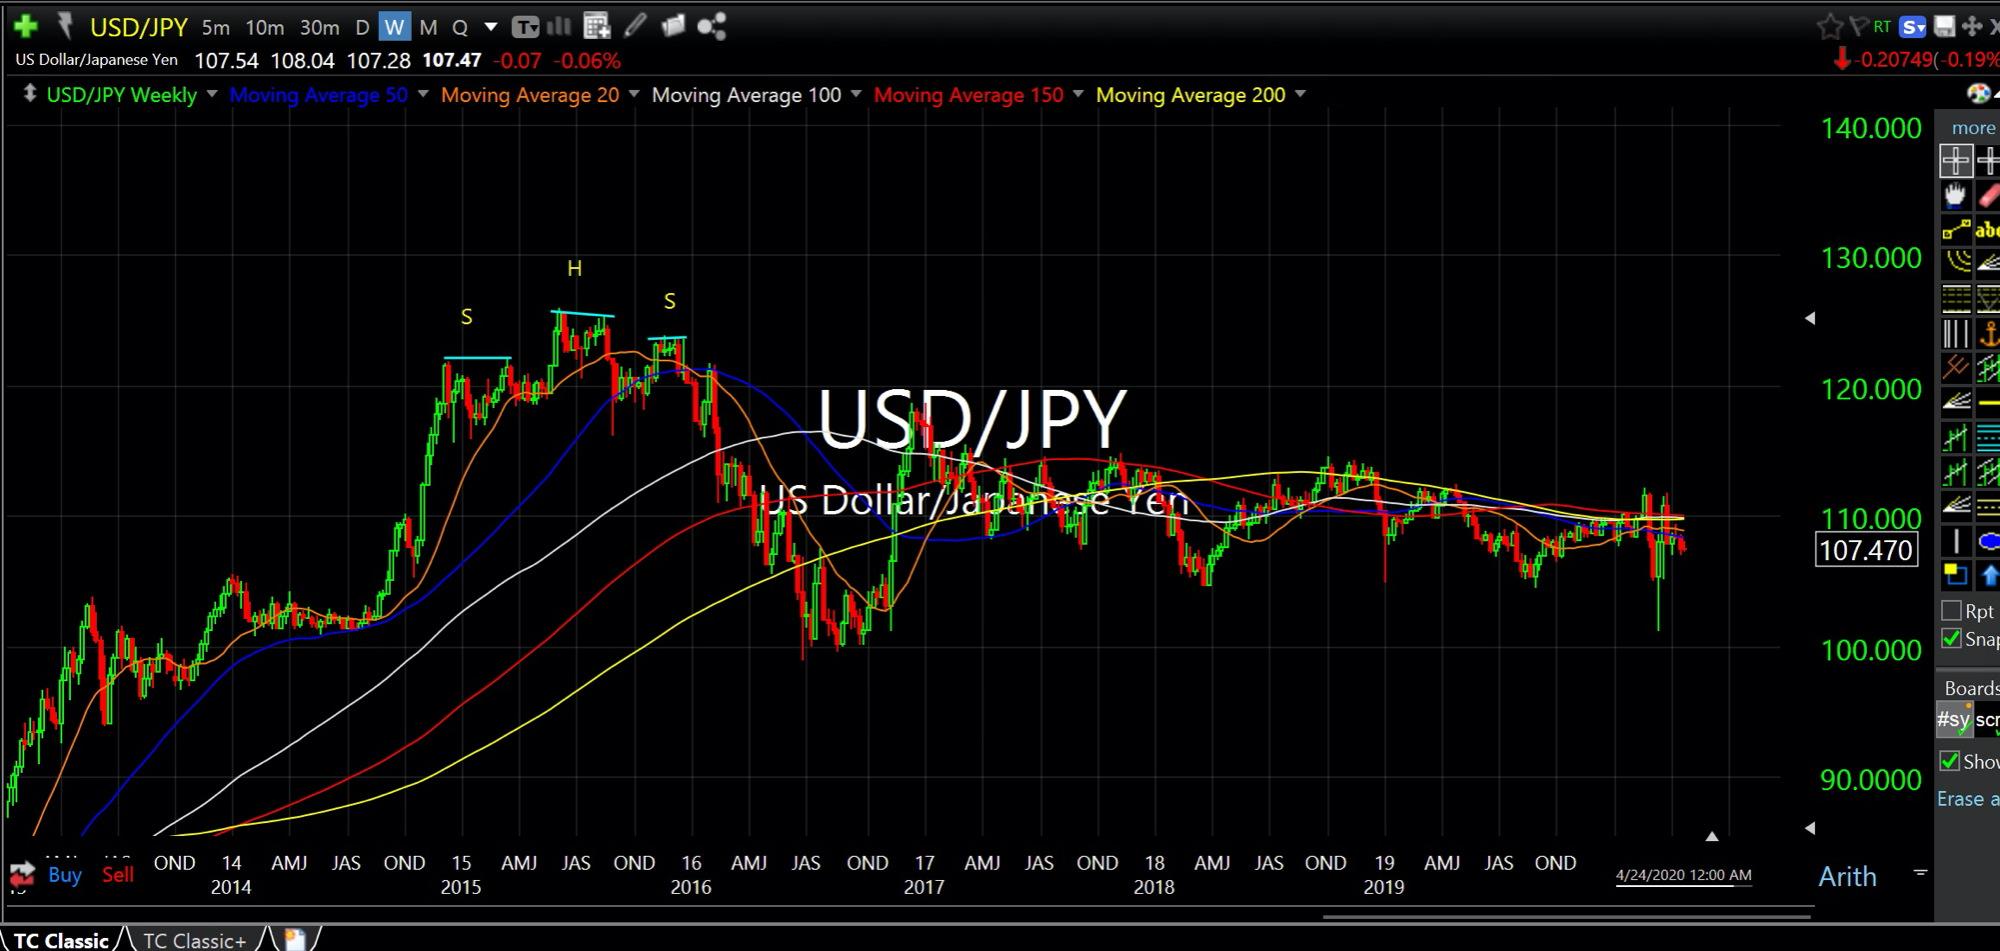
The zoomed-out chart of the U.S. Dollar versus Japanese Yen currency cross, below, may very well have significant implications as far as what Central Banks around the world truly want to happen going forward.
As you can see, those times when the cross has weakened, with the Dollar (the numerator) softening against a strengthening Yen denominator has coincided with periods of disruption in global risk assets.
The Fed, with other Central Banks usually following the lead, has often made various announcements with QE, Twists, rate cuts, and lending "facilities" along the way to stem the tide, especially last month.
In most other currency crosses, The Fed seems to want to avoid a too-strong Dollar for a variety of reasons. But when it comes to Japan, avoiding the spike in the Yen and a revival of the dreaded unwind of the "carry trade" is still a concern.
At what point will The Fed and other Central Bankers lose their perceived grip on the currency (and Treasury) markets? That would be the multi-trillion dollar question, of course.
However, with the highlighted and confirmed major head and shoulders top (an old annotation on my chart which we looked at years ago) from 2015/2016, another sharp leg lower from here in the Dollar/Yen cross would almost assuredly cause further disruptions in global risk assets to accelerate the long-term trend reversal five years in the making.
Thus, if we are to objectively assess whether the worst, in fact, is behind us during this unique cycle then the Dollar/Yen cross ought to be a regular barometer going forward.


