
12Jun11:46 amEST
Ready to Strike

Earlier today I charted a very near-term (5-minute) chart for the small cap stocks in the IWM ETF for Members and also on the main Twitter feed to illustrate the threat of the IWM filling it gap below after a big opening pop. Not long after, the IWM did indeed fill that gap to $135.79.
However, as I write this buyers are doing their usual thing and trying to push us higher for another runaway rally.
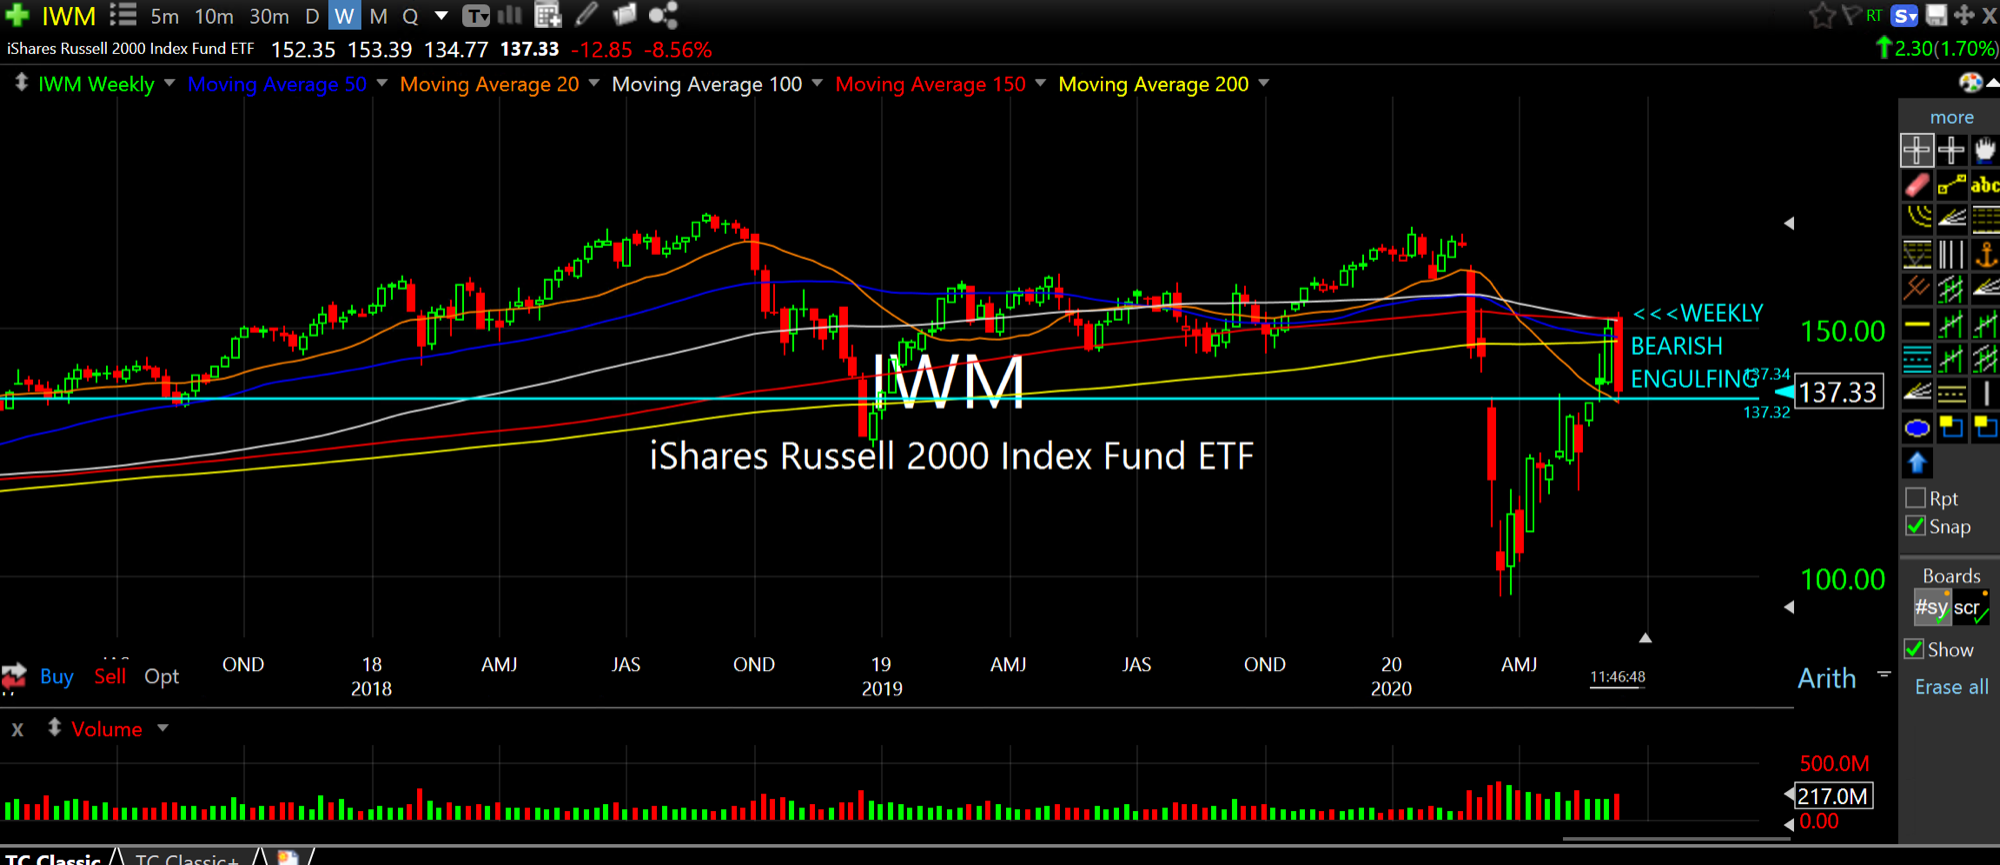
Interestingly, as we zoom out a bit and examine the weekly chart for IWM, below, small caps are on track for a bearish "engulfing" candle, which is the first standard reversal candle we have seen on the weekly chart since the March lows. As the name implies, the engulfing candle literally "engulfs" the prior candle's highs AND lows. In this case, we are looking at a weekly chart where each candle, red or green, represents one week in the market.
Of course, any one candle on any timeframe required confirmation in the direction of a given reversal, which means bears must be ready to strike next week and avoid another in a long line of Sunday evening rocket ships in the futures.
Still, it is worth noting the price level where this battle is materializing: The $136 area on IWM has been a battleground since late-2016 for small caps and thus raises the stakes for this particular showdown into next week.
Also note the VIX and VIX ETFs (TVIX VXX, etc.) staying firm today, at least for now, even as the indices flash green. This is another divergence compared to what we have seen largely since March.
A GDP Play, Socially-Distant... Saturday Night at More-Like-...


