31Aug3:22 pmEST
Truly a Sight to Behold

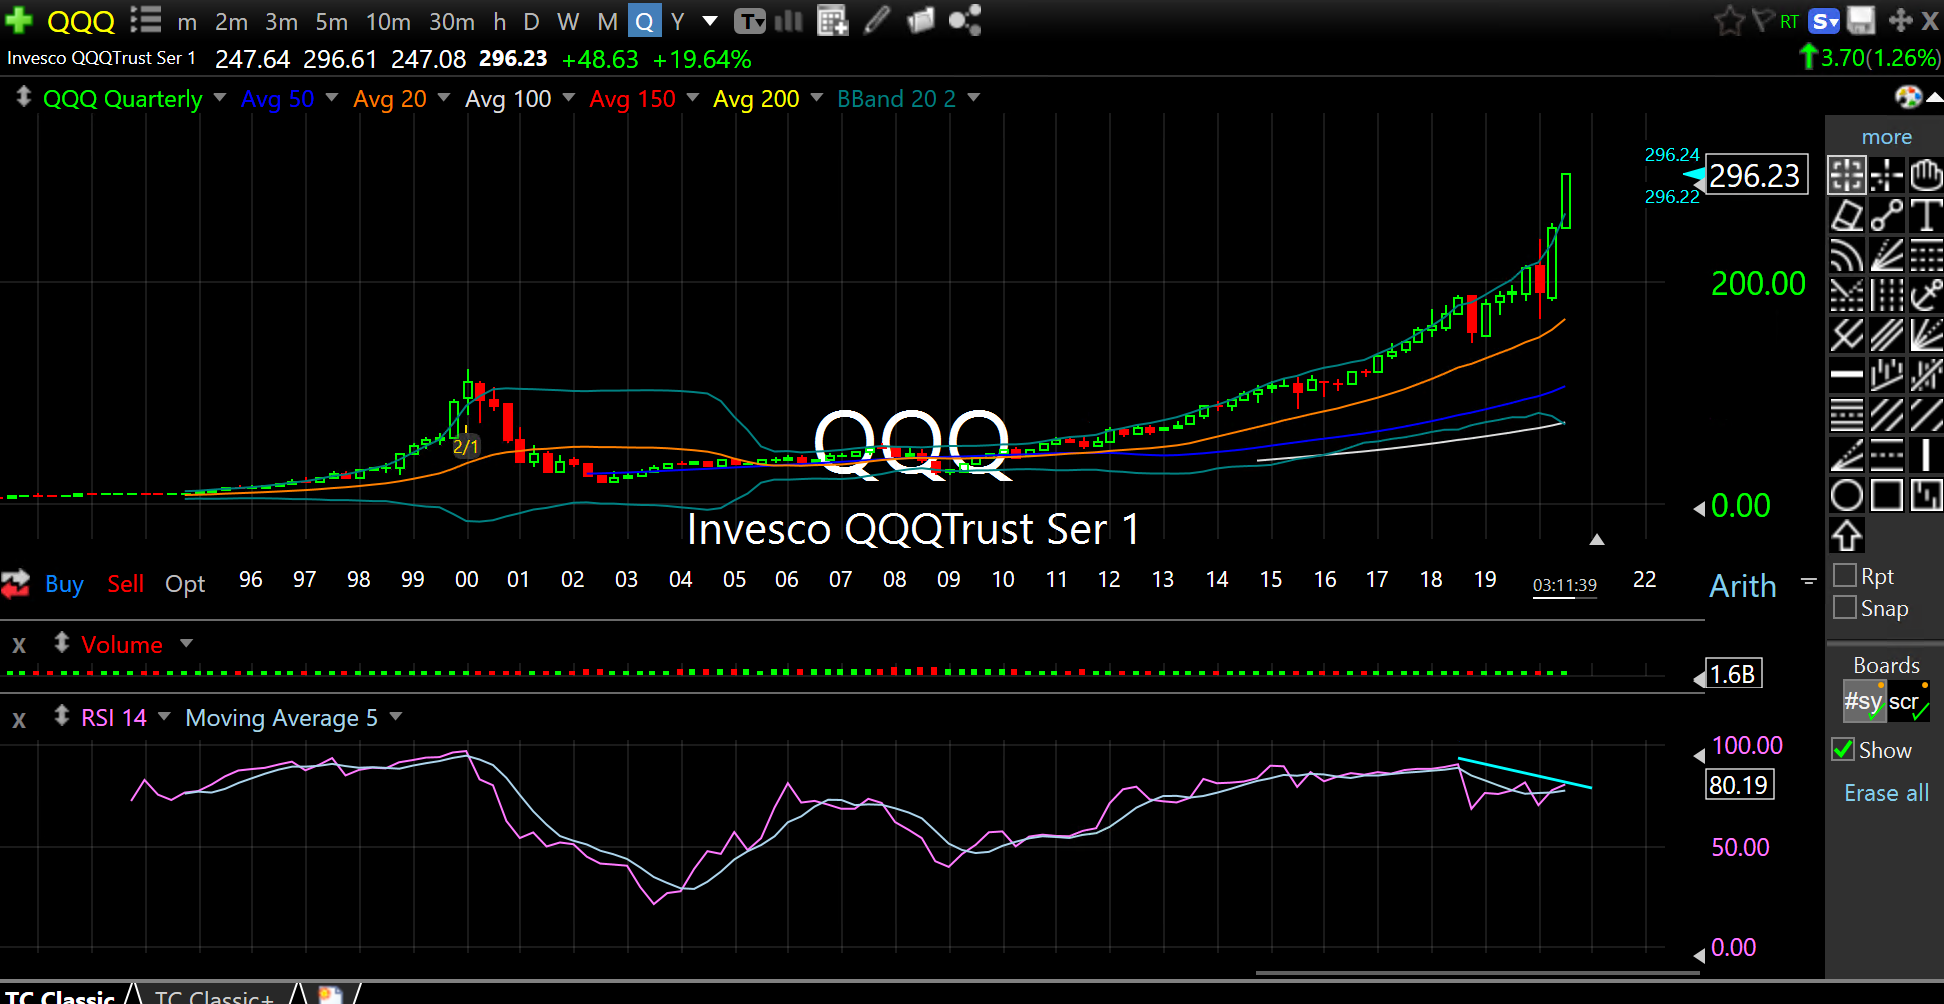
I am mostly sitting out of the never-ending Nasdaq party we are witnessing. Although by now I am sure you have heard plenty of bubble talk and comparisons to 2000, the quarterly chart of the QQQ (which is the ETF for the NDX, or the index of the top-100 market cap weighed stocks in the Nasdaq Composite), below, illustrates the size and scope of the comparison.
Considering where we were in March, with a legitimate WWI-esque threat of shutting down the stock exchange for a few weeks if not months, to now be as far outside of the upper quarterly Bollinger Band on this timeframe as we have perhaps ever have been is truly something to behold.
Something else to note, which I am not sure too many others have focused on, is the negative RSI divergence versus the September 2018 highs (two years ago, basically), as seen on the bottom pane of the chart. This divergence speaks to just now narrow the current rally is in the market, obviously tilted towards mega cap leaders like AAPL AMZN NVDA TSLA etc.. Even another tech monster like ZM sprinting higher without a care in the world into earnings tonight, there is little doubt where sentiment is right now in tech land.
My stance remains the same: We will not likely know what kind of beast we are dealing with going forward until we see how the market reacts to a multi-day (not multi-minute!) pullback/shakeout in the Nasdaq leaders. There are many working theories out there where capital goes then: To the banks? To metals? To crypto? Energy? All or none of the above? Which proves my point--We need to see the first shakeout before we can get an idea of the underlying nature of the run-up in tech leaders.