
05Feb11:11 amEST
Something for You Old School Readers

Over ten years ago, the stock market had been melting higher day after day, week after week, and then month after month since the March 2009 bear market bottom. The new melt-up had a seemingly invincible aura about it, with low volume V-shaped rallied being the norm off any slight dip. Bears (and there were plenty of them back then) were convinced the whole ordeal was nothing more than another extended bear market rally we had seen several times in 2008, which would inevitably be doomed to roll back over and cascade to fresh lows below the S&P's 666 infamous bottom.
Of course, that never happened.
But something funny did happen into late-April/early-May 2010, more than a year after those good lows were in: The S&P began to make higher highs but also lower lows over the span of a few weeks with price swings increasing.
After a few days into May, the market suddenly started to weaken and head down to test its low from prior week when, suddenly, everything broke loose and we had the "Flash Crash" of 2010, which subsequently took several months to heal itself before a new uptrend emerged around Labor Day.
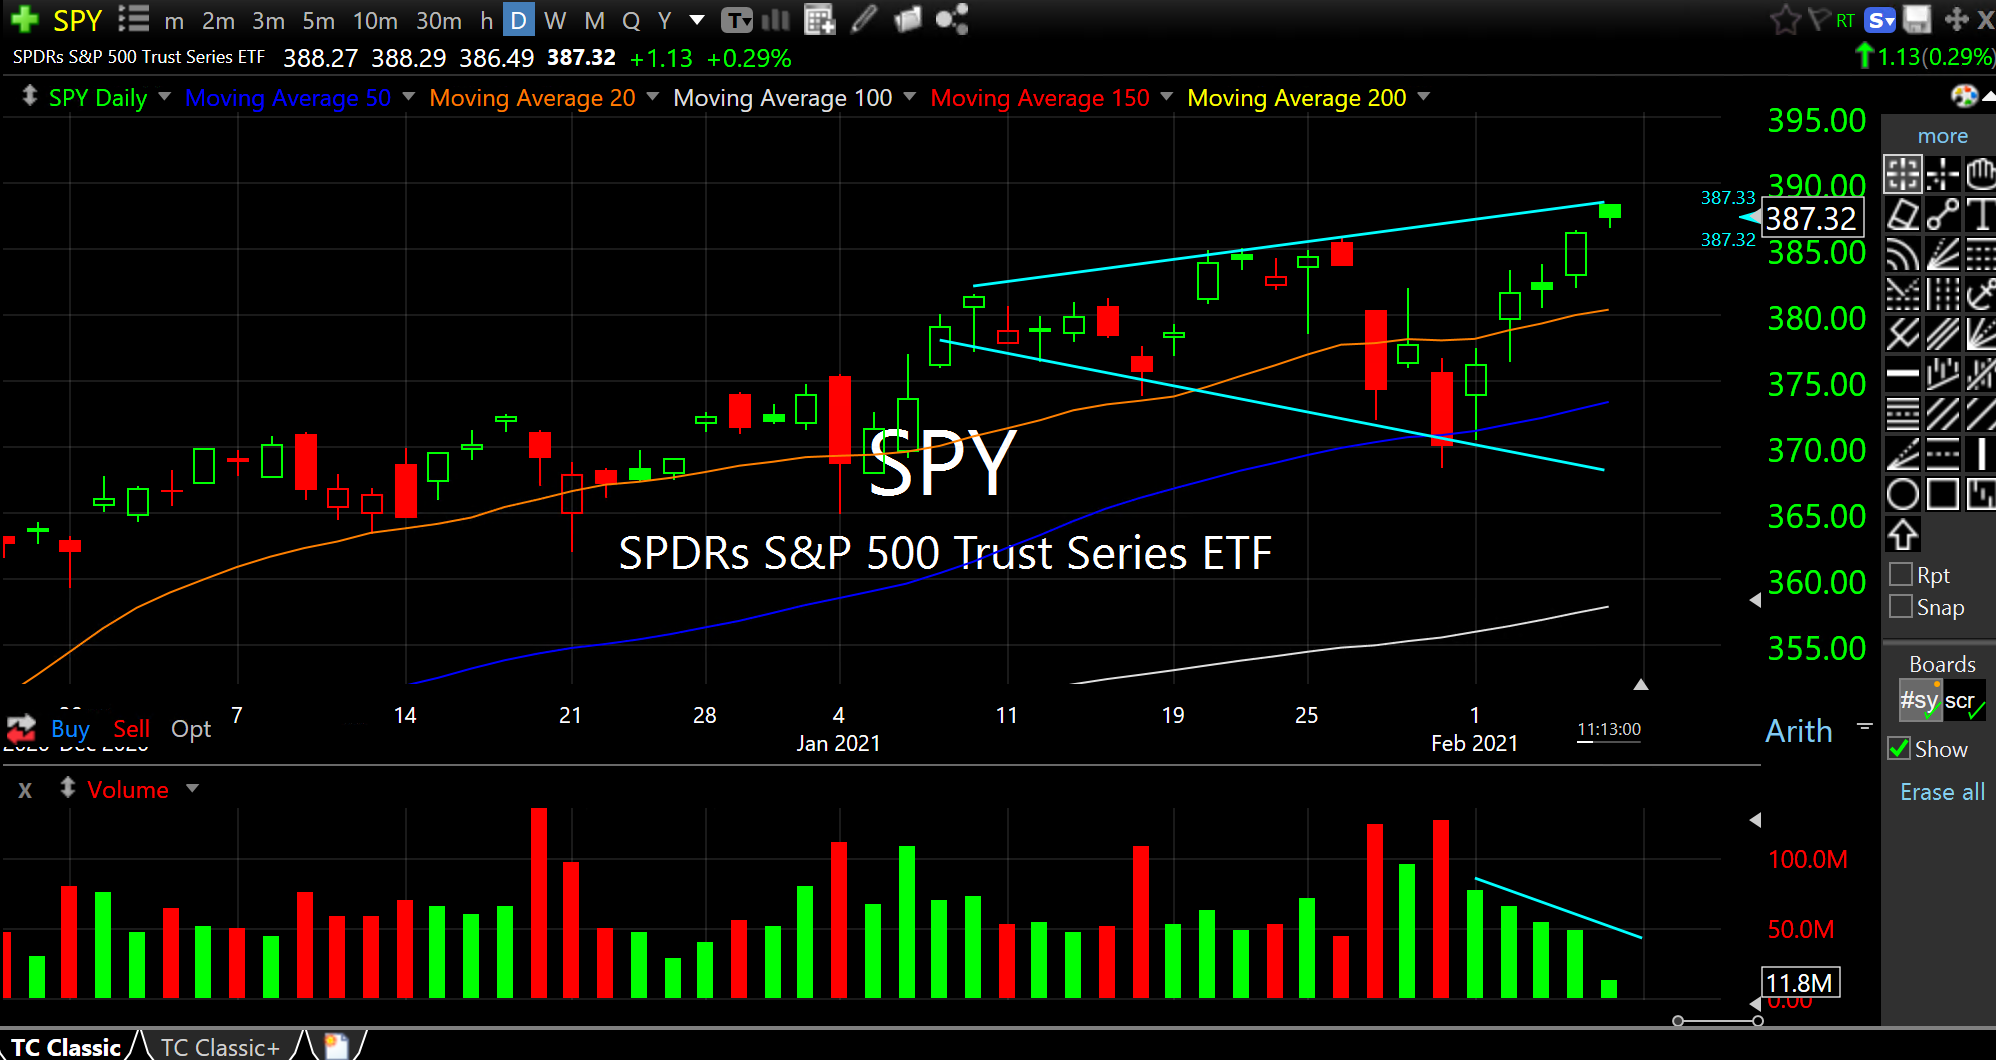
While that was certainly an extreme example, the pattern I described is known as a "megaphone" pattern, which I had written about extensively before the Flash Crash happened. What intrigued me most about the pattern that 2010 context was how easy it was to laugh off and dismiss, since the market had that aura of invincibility about it. The megaphone pattern, only after a steep, established prior uptrend, can be a bearish topping pattern because the suddenly wild price swings denote that buyers are slowly losing their grip on the action to galvanized bears who are putting up a better fight in trying to wrestle back the initiative.
Fast-forward to today's tape, and one of our veteran Members and loyal readers reminded me of the pattern and the current S&P 500 chart, seen on the SPY ETF daily timeframe, below. As fate would have it, the megaphone is at least an interesting working thesis here. Naturally, it only means anything if this current area acts as resistance into next week and turns us lower. But it is food for thought given the wild price swings on the indices in recent weeks.
Regarding the here and now for trades, the micro-caps in the IWC are still blowing off higher. DVAX GMDA LGND SIOX make for some interesting biotech charts I am eyeing.
Stock Market Recap 02/04/21 ... Super Bowl Pick Against the ...


