
14Sep10:12 amEST
You Don't Have to Be Monk to Crack This Case

The consecutive gaps higher this week have been faded, broadly speaking, in most parts of tech. Even going back to late-last week, we saw a Nasdaq which did not want to hold onto strength as each session unfolded, namely Friday into the bell.
When we look to the charts to put this into context (which is what technicals are often best used for, in lieu of trying to make constant, bold predictions) it should become more apparent what is happening.
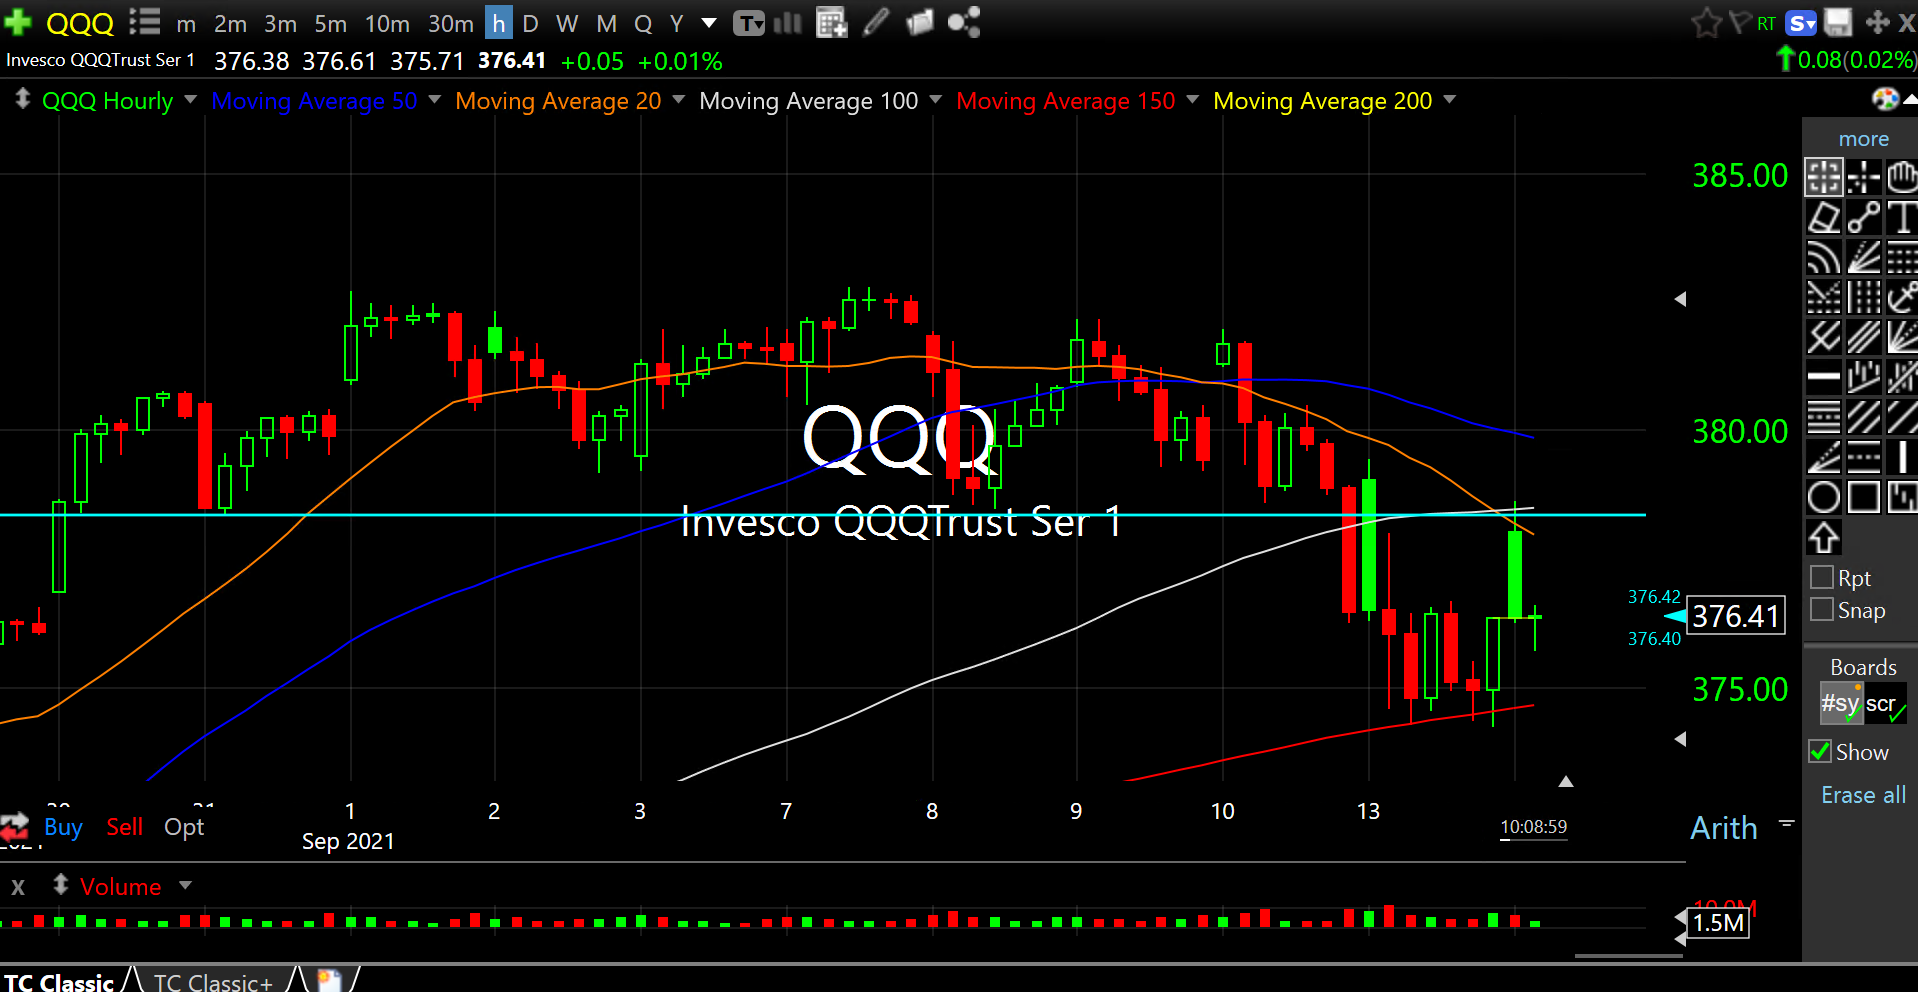
Specifically, on the QQQ ETF hourly chart, updated below, the $378/$379 zone acted as solid support over the last several weeks, dating back before Labor Day in late-August. Friday's slide breached that support, and yesterday morning's gap just back above it failed.
And then this morning's mild pop of what was perceived as a tame CPI number also faded.
At issue now is whether the $378/$379 zone has just effectively converted from prior support into newfound resistance. If so, it is a basic tenet of technical analysis that this is a bearish development.
With the AAPL event later today and then the FOMC in the middle of next week, there will be more opportunities in this post-summer trading interval for the market to make a directional move. Note that I am not just watching AAPL today after its event, but also the semiconductor space (suppliers for AAPL) for reactions, too. Should the SMH falter after a steep uptrend, I would consider that stronger evidence of QQQ bulls finally starting to lose their grip after an epic run.
Gold Miners: At Least We Kno... Stock Market Recap 09/14/21 ...


