10Feb12:20 pmEST
The Ol' Head-Fake Jump

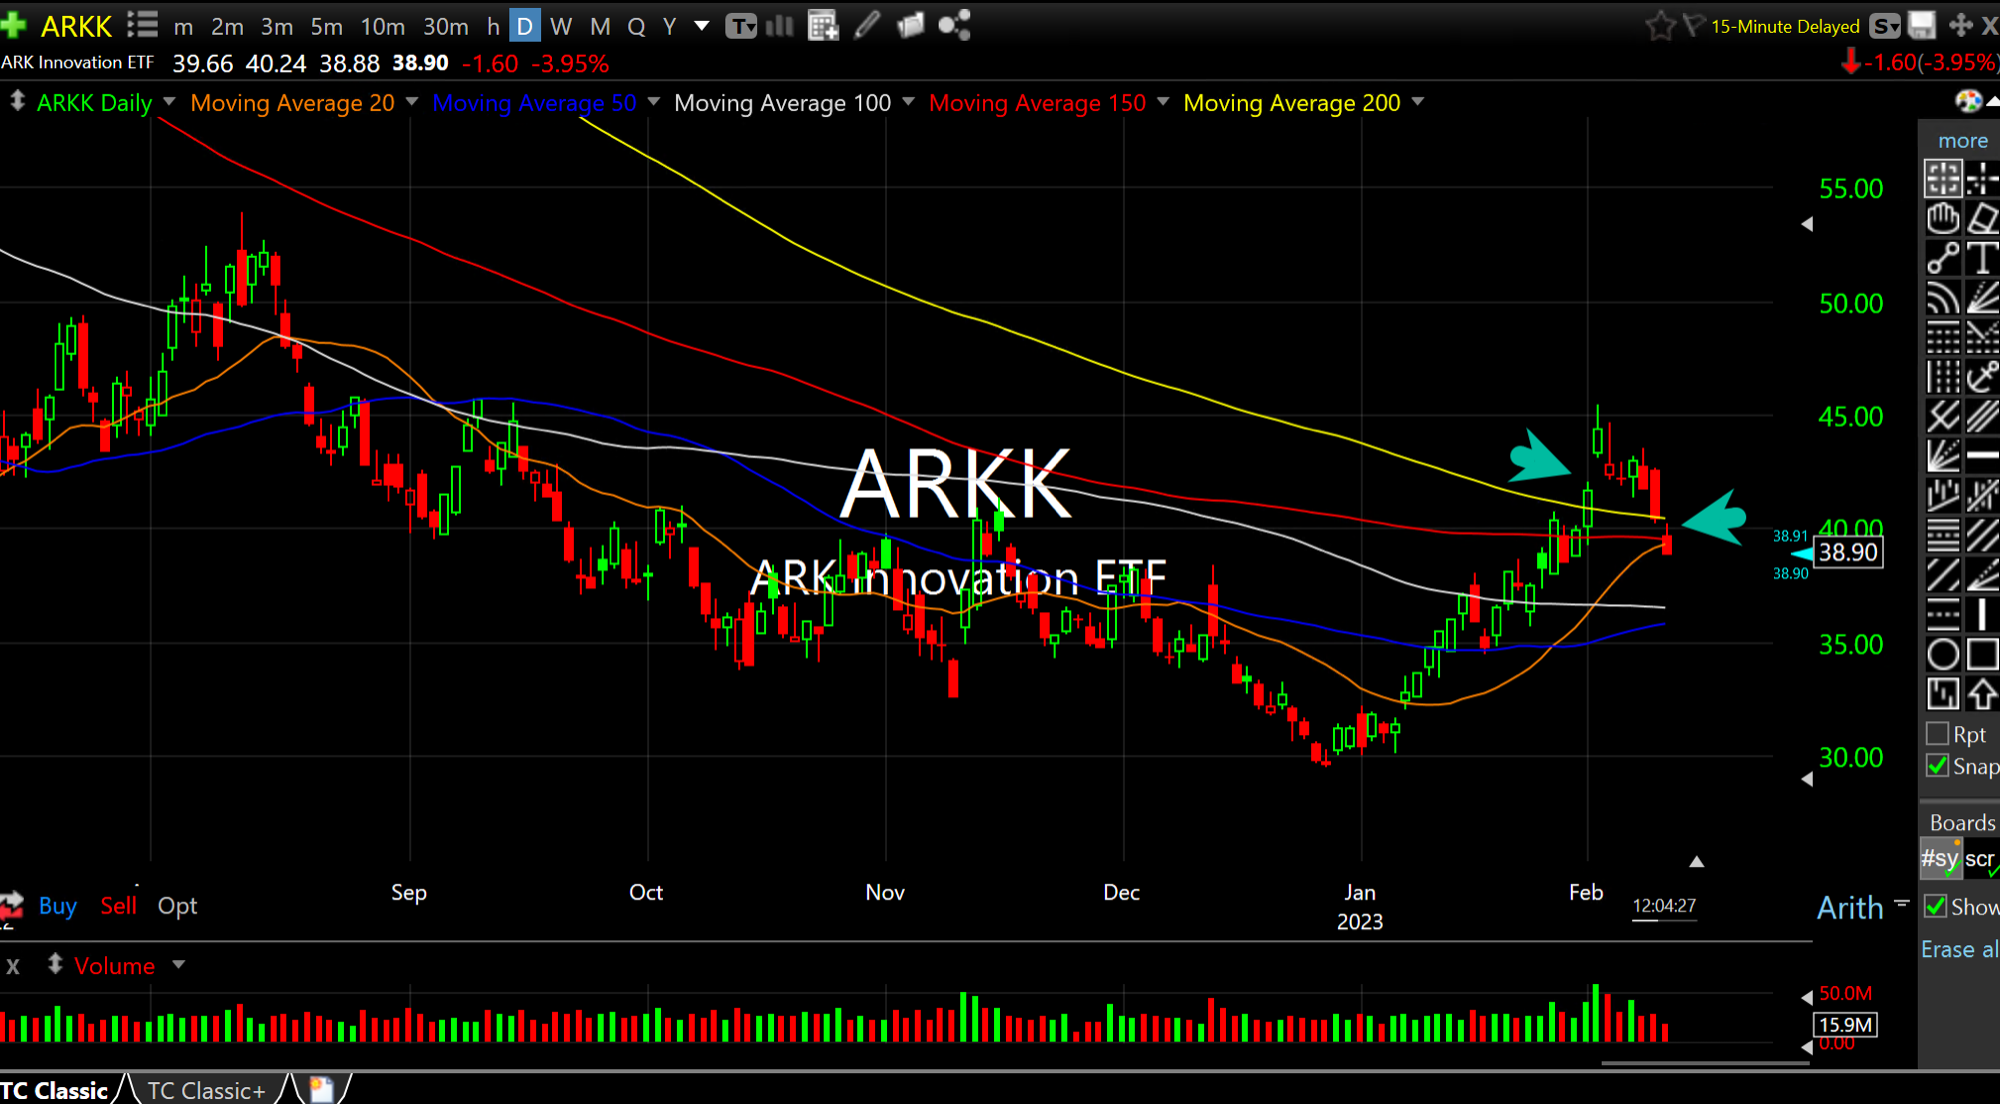
While bulls argue the last few days of weakness is yet another buyable dip and a benign consolidation after the one-way rally since 2023 began, when we examine, for example, the ARKK daily chart (below), there are more concerning items in play.
First and foremost, Cathie Wood's growth stock fund is still sporting a declining 200-day moving average (yellow line) which continues to give the presumption of an ongoing bearish trend until proven otherwise.
Next, you will note that ARKK actually holds TSLA which has nearly doubled since the start of 2023. And, yet, despite big Tesla and its big market cap, ARKK still has a declining 200-day. This also applies to the recent meme stock bonanza, which did not help ARKK technically as much as it probably should have.
Furthermore, ARKK is now back below its 200-day today, as you can see below.
So, after all the rallying, all the calls for a new bull market wall of worry, all of the calls for inflation to be crushed amid a Fed pivot, and well, all of the calls for...call options...we have the most visible growth stock fund ETF back below a declining 200-day moving average.
In the coming days and weeks I am looking for the same type of move from the semiconductors in the SMH ETF, as well as software in IGV.
As it stands now, and I will have more to say on this with Members over the weekend, the CPI and options expiration next week loom as key battleground events as both sides will be put to the extreme test.