09Mar10:17 amEST
Make an Example Out of Them

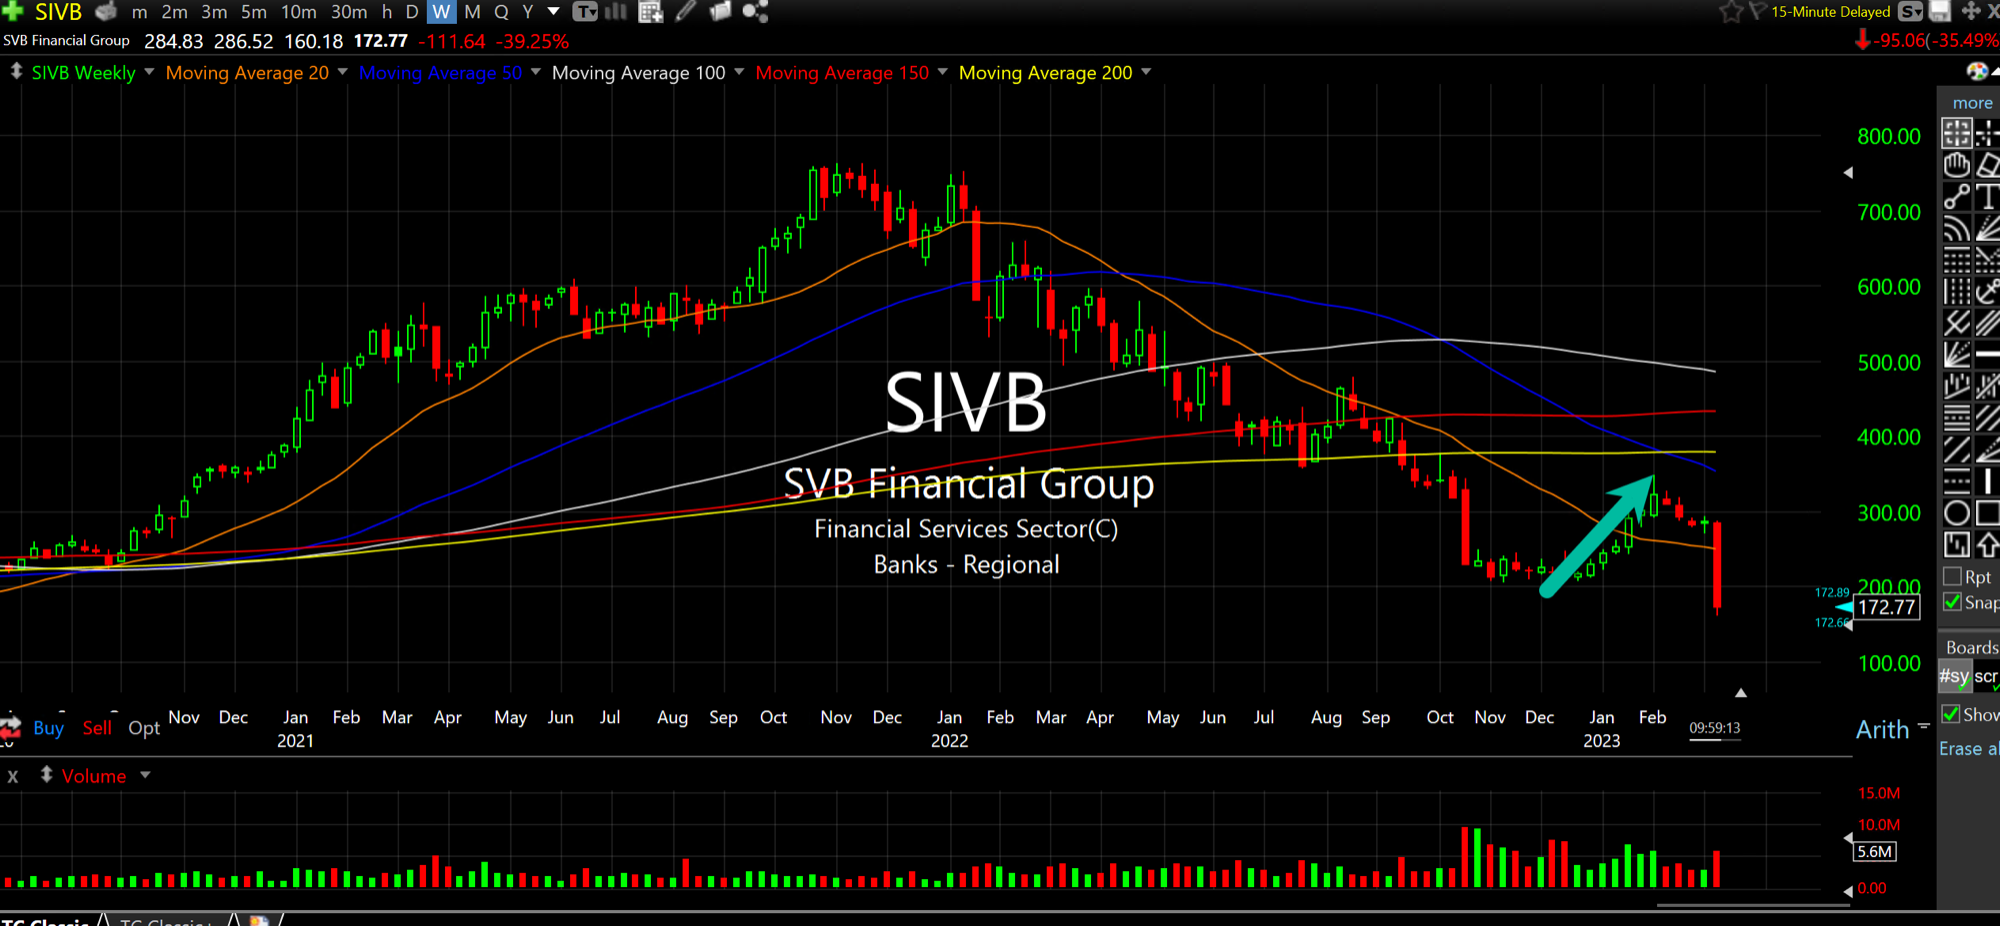
SVB Financial Group, below on the monthly chart, is getting walloped by more than 35% this morning after it launched a $1.75 billion share offering to try to salvage its balance sheet. The lender has many startups struggling from venture capital funding.
Even though the broad market is staging a post-jobless claims bounce (it is fading noticeably as I write this), I do think SIVB serves as an example, albeit an extreme one, of the type of long-term technical analysis we have been utilizing whereas many others seem focused on the daily or even intraday, 0DTE type of mindset.
Specifically, SIVB rallied from a low of $198.10 in December 2022 to a recent high of $348.06 in February.
That is obviously an incredible move on a percentage basis, especially when viewed through tunnel vision.
But when we examine the monthly chart as a whole, it drives home the point that, yes, it can STILL be merely a bear market rally even with a move of that size.
Hence, even with SIVB being extreme in its move today, I would not rule out other names like NFLX TSLA which have made similar explosive rallies since last year's lows following suit eventually, even if the path lower is not with the same dramatic flair as SIVB's.