22May2:18 pmEST
Learn Your LULU Lesson

When shares of Lululemon hit new all-time highs last December 2023 it was quite fashionable for bulls to boast about how LULU was just like COST GOOGL MSFT NVDA and other nonstop, crowded winners who simply could not lose in this market.
Since then, as you can see on the monthly chart for LULU, first below, the stock has tumbled violently without much of a reprieve for trapped longs, from $513 to a recent low of $298.
The take-home lesson is to understand that even the temptation of LULU leggings are for flings only, not marriage insofar as investment is concerned.
I recognize the consensus now, even from many bears, is that there is too much will from Powell and Yellen for "them" to let stocks fall. But that sort of view has been consensus before and has always been proven to be tested with at least a scary correction, if not more, once it becomes ubiquitous.
Also note the "bull trap" (arrow or false breakout, ) on LULU, which I expect to see more of this summer, be it from GOOGL MSFT and others.
NVDA earnings tonight, of course, are a wildcard. But memories of CSCO in the spring of 2000 have me thinking the firm will beat lofty earnings but the stock will sell off anyway and finally bring the AI craze back down to sanity.
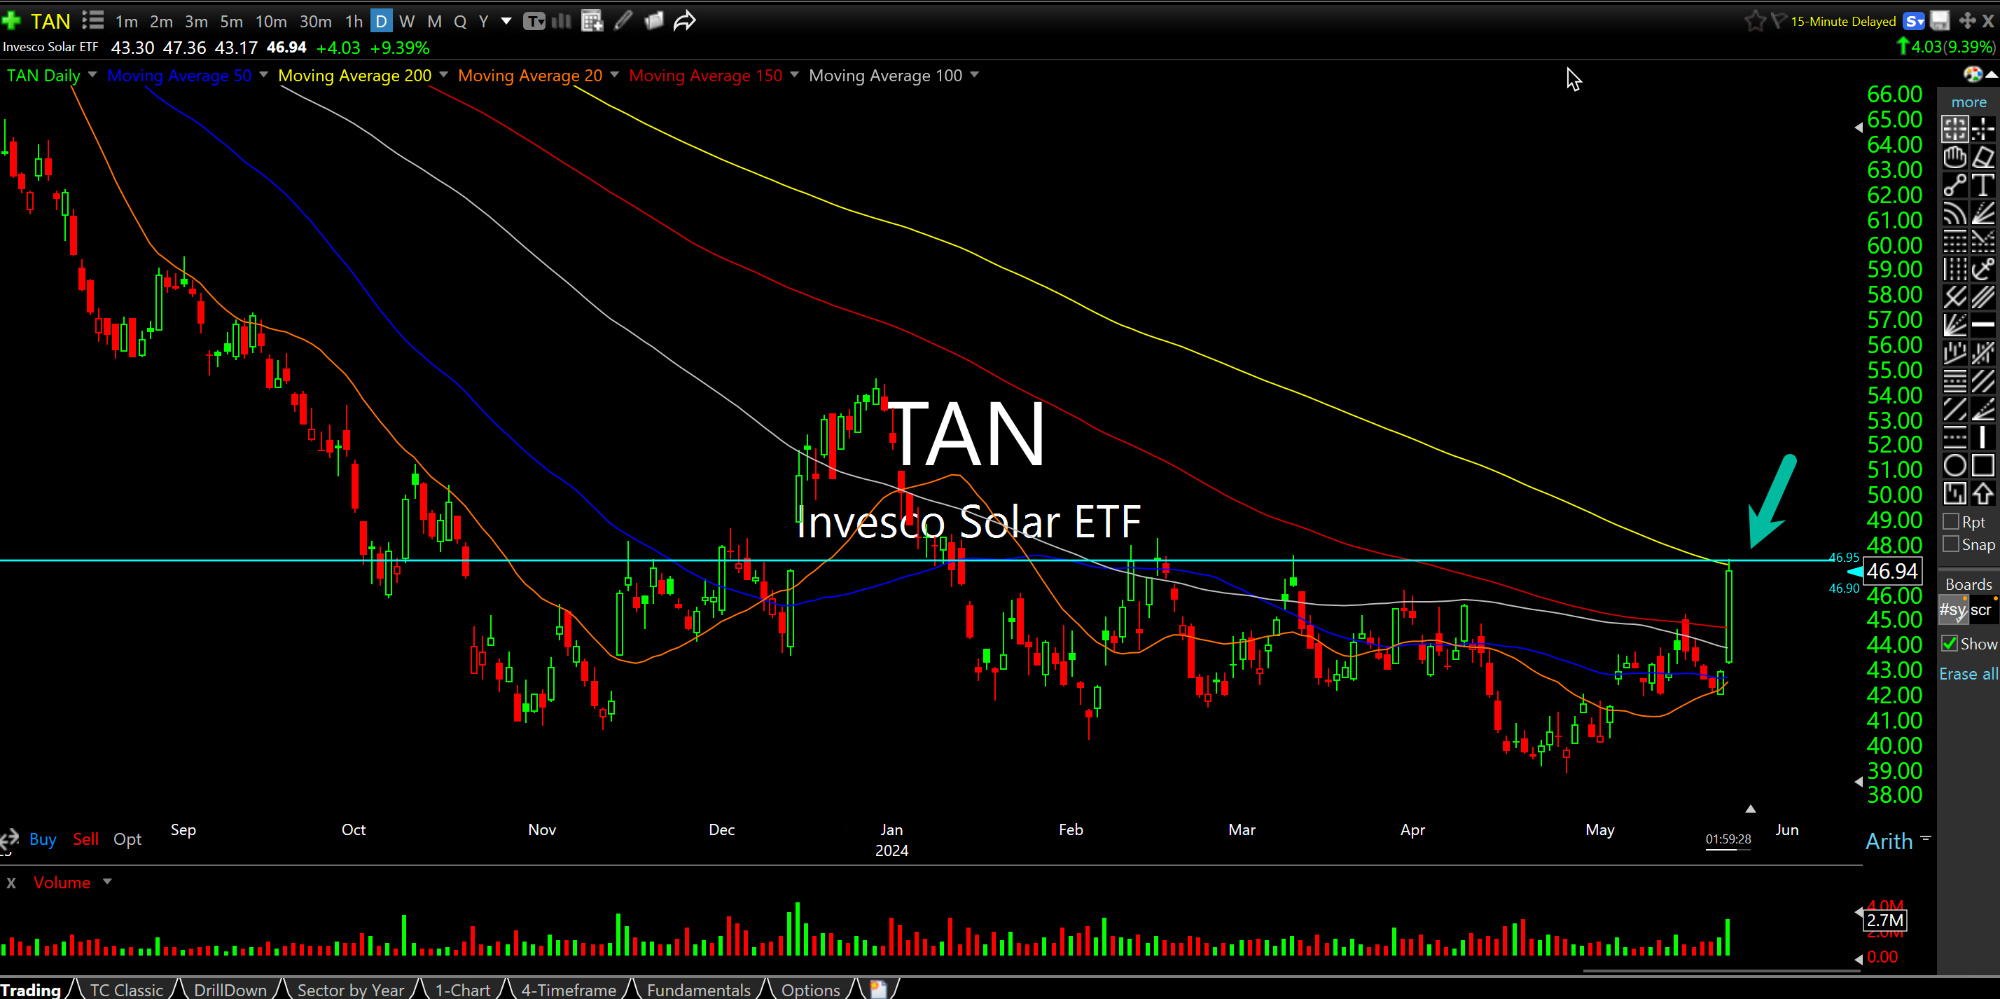
On that note, solars are getting some AI love today, led by FSLR. On the second chart below of the TAN sector ETF daily chart, watch that 200-day moving average test to see if this move has legs for possible rotation, especially if the semis themselves happen to cool off.