09Sep11:57 amEST
A Natural Buffer

I went short small caps last week inside the service for Members using a long bear ETF as a way to play for the fashionable rotation play over the summer to unravel. Thus far we have seen some weakness out of the IWM, ETF for the Russell 2000 Index.
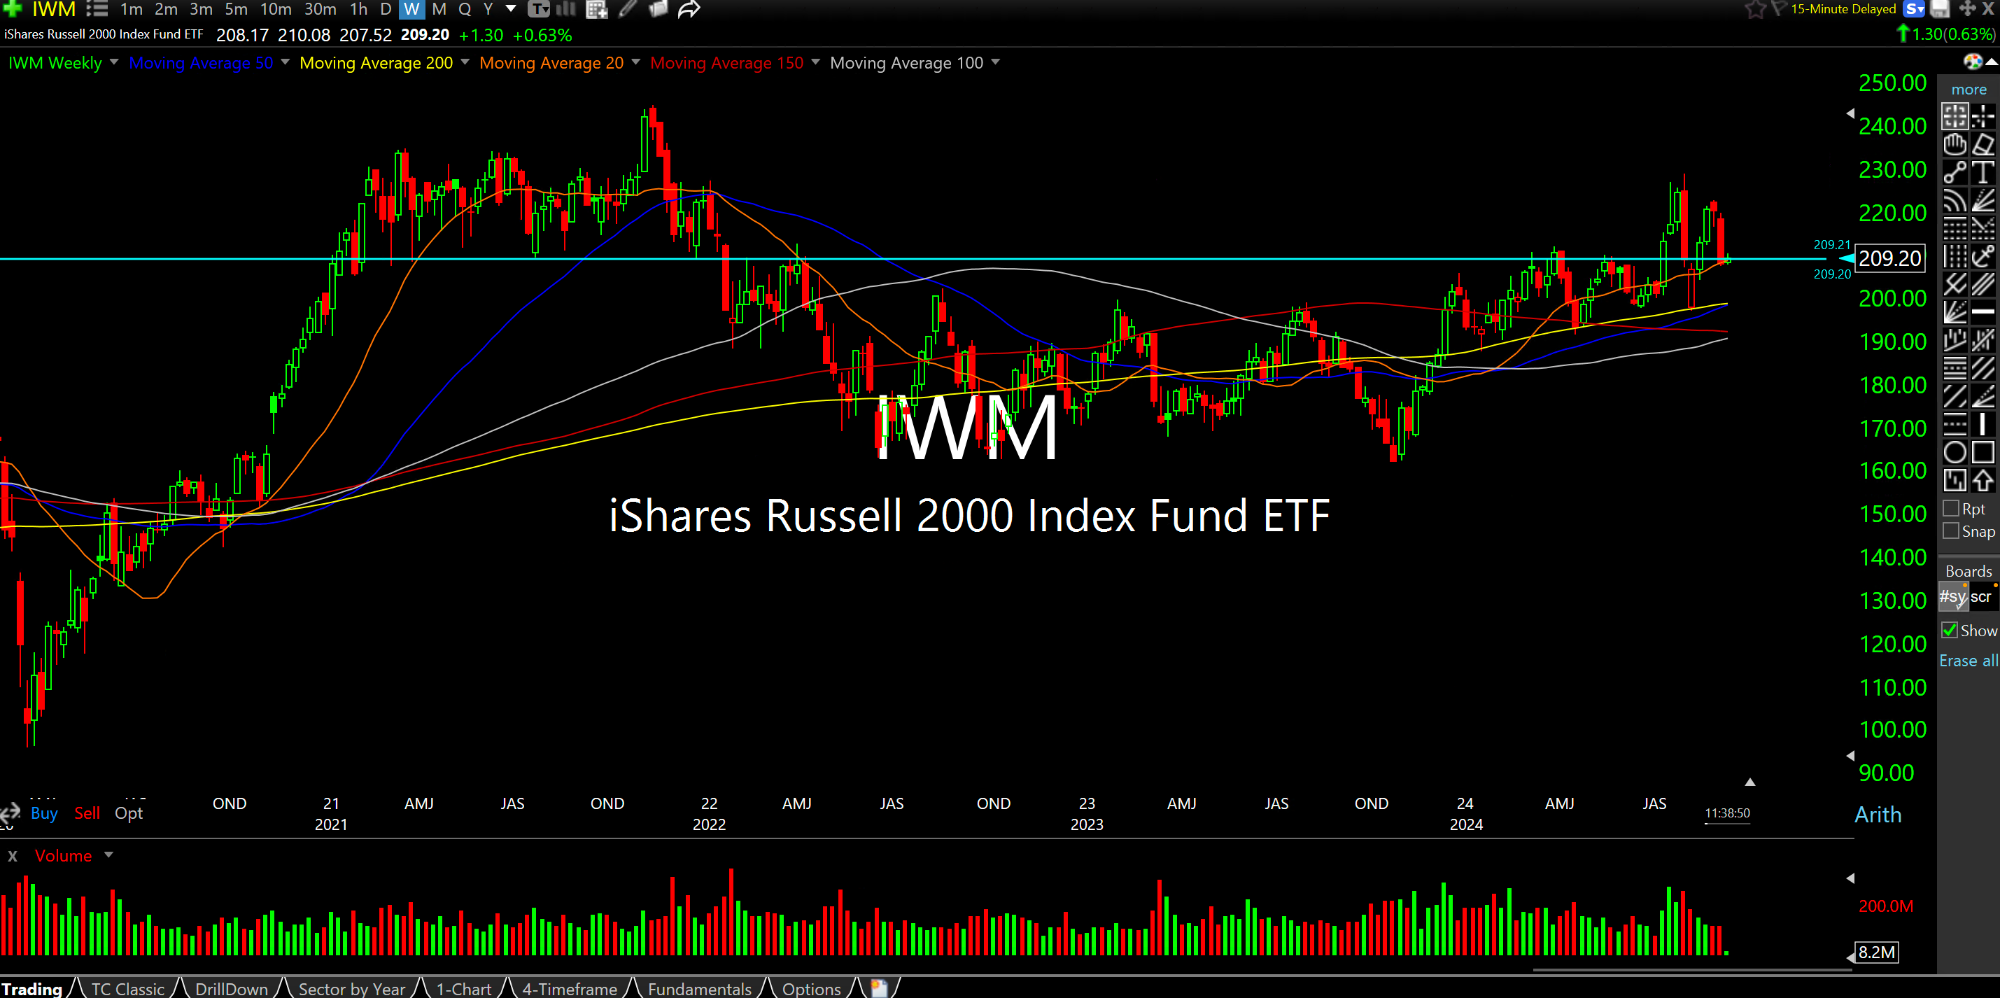
However, the larger point seems apparent when we zoom out to a longer-term timeframe, beyond filling daily chart gaps below, as the ETF has done of late.
On the weekly chart for the IWM, below, the $208/$209 level has been a natural buffer for well over three and half years now. Simply put, the small caps have done a whole lot of shaking, rattling, rolling, squeeze, selling, and fading, only to keep arriving back at this level.
Breakouts, like in November 2021 and over this summer, as well as breakdowns, such as throughout 2022 and last year, have been faded ruthlessly to punish just about everyone involved.
Going forward, the pertinent issue is whether bulls are correct that rate cuts will galvanize the small caps in the coming quarters. And while it is certainly nice to be optimistic, the fact remains that the risk of a slowing economy amid the inflationary/rate hiking previous environment seems too high to ignore for the smaller and more vulnerable firms.
As for the market bounce at-large today, we are still well within Friday's sizable selloff ranges on the major indices. So it is hard to view this as anything other than a near-term oversold relief rally.


