30Sep12:39 pmEST
The Ruins of Quarters Past

Today's closing bell marks the end of the month of September as well as the third quarter of trading, making the quarterly candlesticks on charts fully complete.
For a lesson in history, consider the quarterly candles that Cisco, the star of the dot-com bubble twenty-five years ago, was sporting at the turn of the century on the first quarterly chart, below (arrows). Note the sheer size of these candles on the way up, when it seemed unstoppable, and then on the way down--The size of price swings tends to crest at major market turning points.
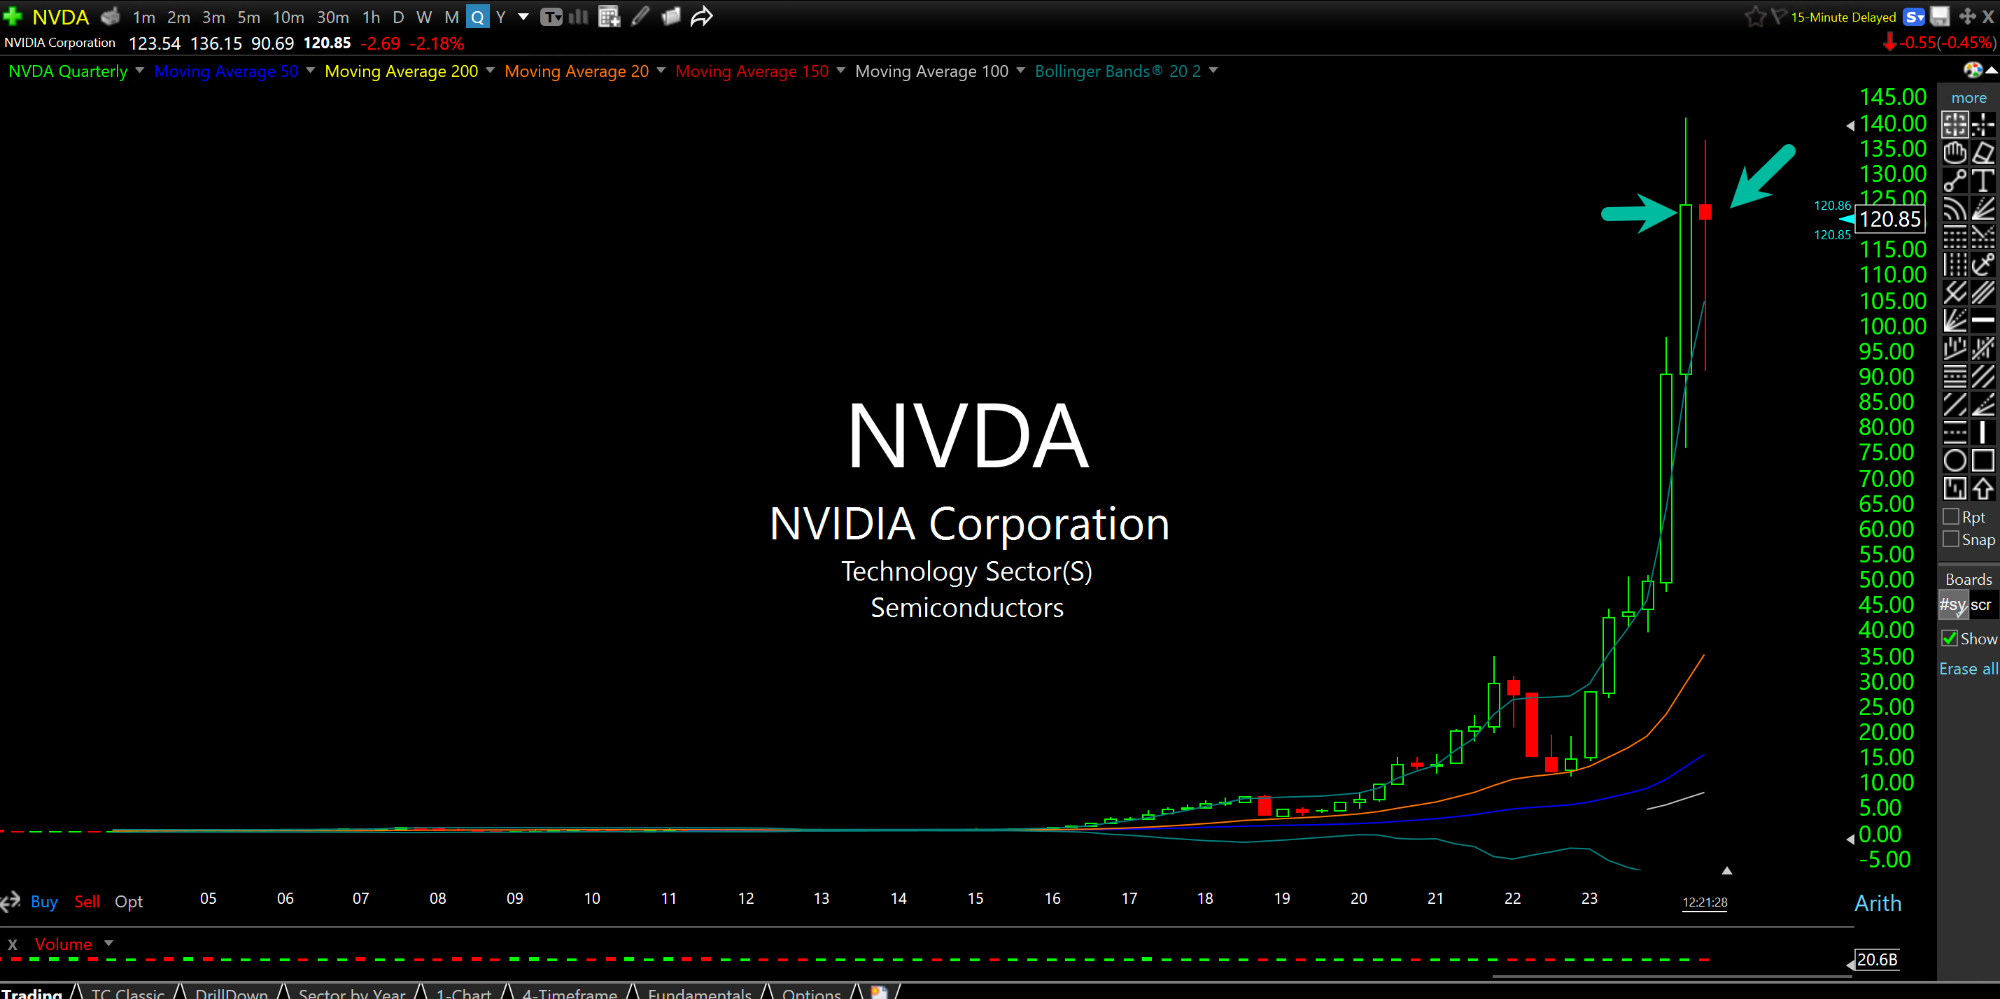
And now compare those quarterly candles in size and location to the current NVDA look, second quarterly chart, below.
Here, again, we have a seemingly unstoppable, groundbreaking innovative leader which has gone much higher for much longer than even the most wild-eyes bulls could ever have imagined.
Similar comments apply to the Nasdaq-100 and semiconductor quarterly candlesticks as they wrap up today, too.