24Jun11:00 amEST
Micron Macro

Semiconductors are displaying relative weakness as I write this amid a broad market morning bounce to respond to yesterday's sharp Nasdaq-led selloff.
However, we have to be honest that this is all prologue to the ~$1.2 trillion market cap Micron Technology, Inc. earnings event this evening. And that is all the more pronounced given that we are, essentially, in the earnings offseason with MU being an outlier reporting now. Tomorrow morning also features a string of potentially market-moving macro data points, to boot.
But I suspect if we get a sizable earnings reaction from Micron then that will be the controlling news event for the rest of the week, particularly if something catches the market off guard in either direction.
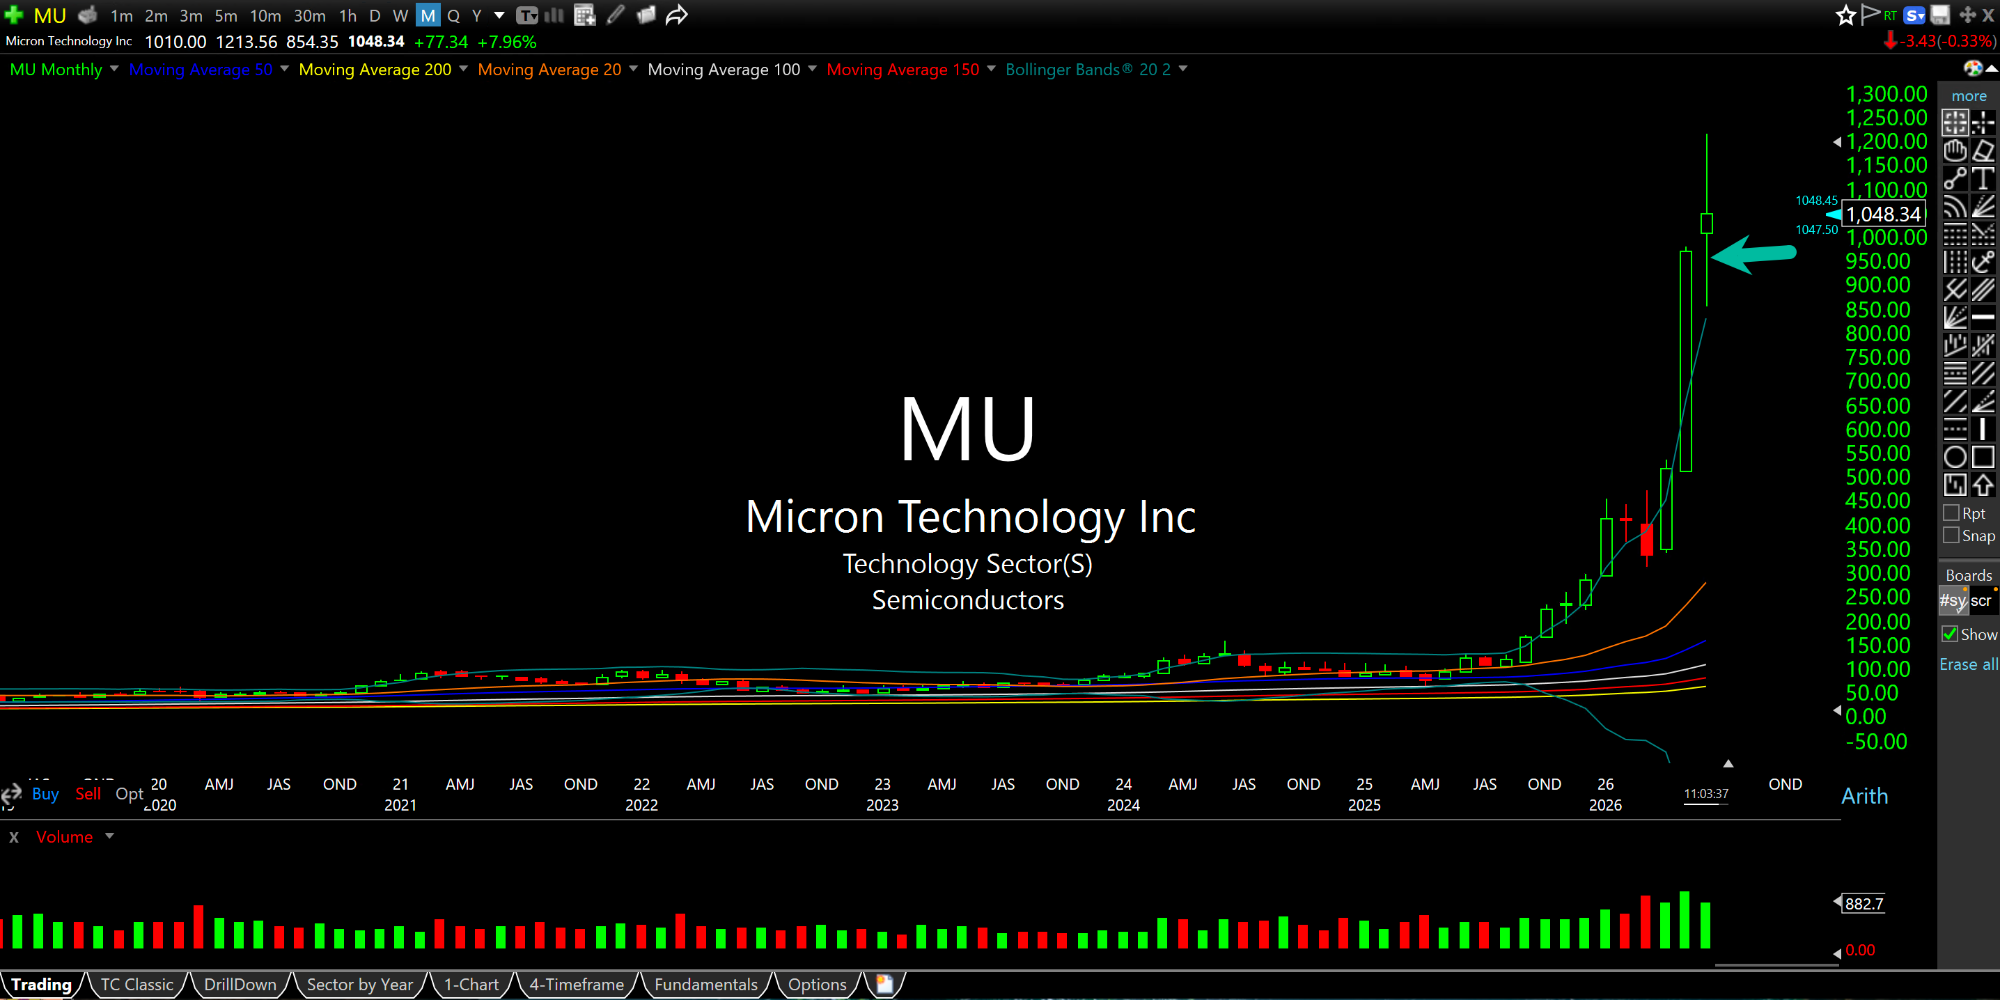
What strikes me as significant about the Micron chart, examining multiple timeframes, is the monthly chart (below) featuring the nearly-complete (on the close of June 30th) monthly candle (arrow) for June. You will note that the candlestick is entirely outside of the upper Bollinger Band, John Bollinger's eponymous indicator which signals extreme, historical overbought conditions in this context. The sheer ferocity and rapid ascent of this melt-up, thanks in part of former Fed Chair Powell refusing to take away any part of the punch bowl when it was his job to do so, brings us to where we are now.
And the only way it persists is if the madness of crowds keeps extrapolating unrealistic growth years beyond what it already has.