26Jan11:28 amEST
A Good Place to Look for Pyramids
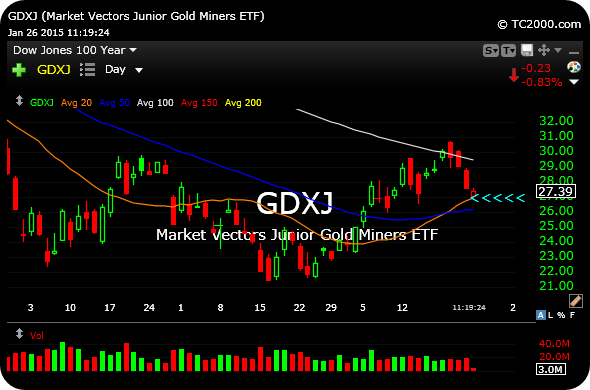
 That 20-day simple moving average (orange line, below) on the following GDXJ daily chart is a logical place to look to see if aggressive bulls will "pyramid" into their positions, or add into them.
The GDXJ is the ETF for the junior gold miners, which are typically an excellent gauge of risk appetite in the precious metals and miners complex, or lack thereof, due to their high beta nature.
Overall, the junior have seen a potent rally since Christmas in what it is still a long-term bear market trying to prove itself as a major bottom, leading to a new bull. In order for that to happen, it is likely bulls will have to vigorously defend that $27 area at the 20-day to form a major higher low.
If that does not hold, I suspect $26, the 50-day moving average (dark blue line) area becomes last line of defense for the short/intermediate-term bull case.
That 20-day simple moving average (orange line, below) on the following GDXJ daily chart is a logical place to look to see if aggressive bulls will "pyramid" into their positions, or add into them.
The GDXJ is the ETF for the junior gold miners, which are typically an excellent gauge of risk appetite in the precious metals and miners complex, or lack thereof, due to their high beta nature.
Overall, the junior have seen a potent rally since Christmas in what it is still a long-term bear market trying to prove itself as a major bottom, leading to a new bull. In order for that to happen, it is likely bulls will have to vigorously defend that $27 area at the 20-day to form a major higher low.
If that does not hold, I suspect $26, the 50-day moving average (dark blue line) area becomes last line of defense for the short/intermediate-term bull case.