
07Aug10:33 amEST
Signs of an Undertow

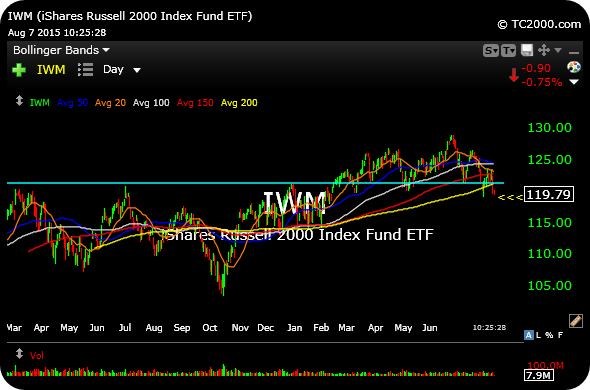
In addition to the Dow Jones Industrial Average, the small cap issues in the Russell 2000 Index are no seeing price operating below their respective 200-day moving average.
On the IWM, ETF for the Russell, daily chart, below, once price lost the $121.50 level (light blue) we have been steadily observing inside Market Chess Subscription Services as a key dividing line, the idea was to think twice before taking on too much long exposure.
And that strategy looks to have saved us from half of the battle in these types of markets--Avoiding the damaging drawdown.
Going forward, I am looking to see how aggressively buyers can step in here. Recall that the 200-day moving averages on both the Dow and Russell are stilling rising, meaning the multi-year bull is intact, for now.
But some other reference points we have been discussing are worth of being monitored, too, as the undertow of some of the weaker parts of the market tries to talk out the former leaders with it.
Stock Market Recap 08/06/15 ... The Clock is Still Ticking f...


