31Aug2:55 pmEST
Black Gold Rally in Spades Aligning Smartly

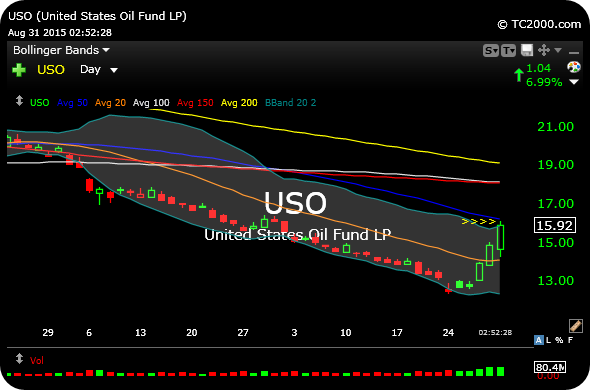
Into this rally in crude oil today, which smacks of a contention of a painful short squeeze to punish latecomer and cocky shorts, the updated USO ETF daily chart, below, sees price up to a confluence of significant technical levels.
USO is now short-term overbought, at the upper Bollinger Band, which basically runs into the declining 50-day simple moving average (dark blue line).
This are should be the first important test to see whether this is a run of the mill short squeeze in crude, or rather the makings of a large bottom. To be sure, a rally like ACI has seen is not required of crude for a major bottom.
But not seeing swift rejection away from these levels would be the first thing to look for in the bull camp. That said, it is worth noting that equities in general and even many energy stocks are not responding with the type of vigor you would expect from a crude rally of this magnitude, which is a point bears are sure to latching on to.