09Feb10:45 amEST
Digging Out from a High Energy Storm

One of the major themes from last night's full video for Members was that the energy sector was likely as a do-or-die spot.
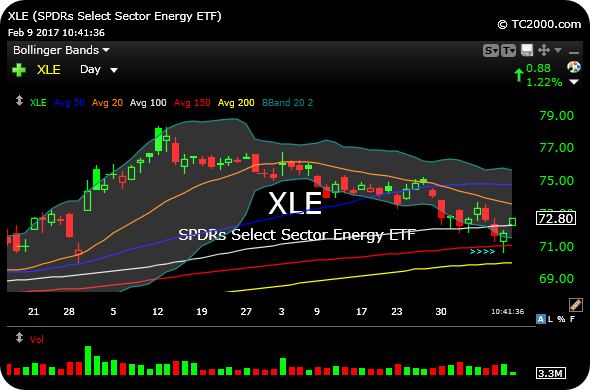
Specifically, after several failed reversal attempts in recent sessions, the XLE (energy sector ETF) printed an even more prominent reversal daily chart candlestick yesterday from oversold conditions. After a prior, established down move, a candlestick which closes near session highs after probing much lower earlier in that candlestick's duration (here, a daily chart, so each candle represents one day of trading) then puts us on watch for possible upside reversal continuation.
Of course, during a pullback, it is expected to see one or more failed reversal candles, respecting the momentum down.
But after a certain point if bulls should fail to arrive and grab ahold of any reversal candles, it open up the distinct possibility for a complete washout lower. Those types of swoons essentially amount to longs being like frogs in the proverbial slowly boiling pot, realizing the magnitude of the downtrend after it is too late.
Thus, this morning's action is a promising start for this latest reversal candle, with energy names mostly gapping up. I would almost prefer that trades focus on the likes of TWTR (which looks to be a dead money chart, once again, for quite some time barring a buyout) instead of overly bullish too soon into this energy bounce.
Either way, a protective stop-loss below yesterday's lows, if not tighter, now present a better defined setup to manage risk for any longs.

The First Move After the Fed... A Day of Inter-Market Confro...


