07Feb3:34 pmEST
Facebook and Snapchat: Watching the Same Movie Again?

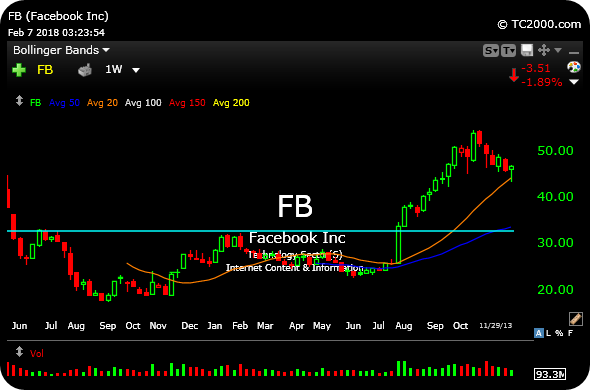
The first chart pictured below is a blast from the past--Facebook's weekly timeframe dating back to 2012/2013, after its post-IPO slump. FB actually dipped into the teens, amid a plethora of negative media coverage and frustrated shareholders.
Eventually, though, just when all hope seemed to be lost, the company steamrolled a summer earnings report in 2013 and never looked back. In fact, the stock wound up running from a low of $17.55 during the malaise to a recent high of $195.32, and it still may be be done going higher.
With this in mind, we must consider whether Snapchat has just turned the corner in its own right.
Like Facebook, SNAP featured months on end of disappointing price action after its IPO. The name was essentially so bad that the hot money traders no longer bothered to even mention or scan it, let alone trade it.
And just like FB, SNAP is suddenly exploding today after an earnings report which I am sure most half-expected to be another dud.
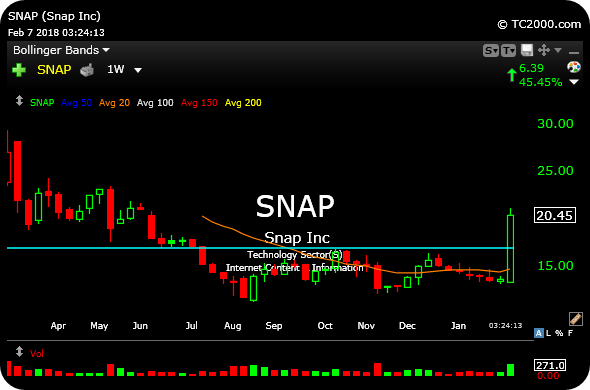
Bring us to the present, SNAP's real-time weekly chart, second below, looks an awful lot like FB's back in 2012/2013.
Going forward, a technical key for SNAP will be for today's massive gap (better seen on a daily chart than the weekly charts, below) to go unfilled, thereby creating a standard bullish breakaway gap higher which, as you would presume, "breaks away" from the considerable period of malaise and commences a fresh bull run. The specific price area would be $16/$17: Holding well above there opens the door to a new phase in SNAP's stock.