
28Nov3:33 pmEST
Crossing Over from Fall to Christmas

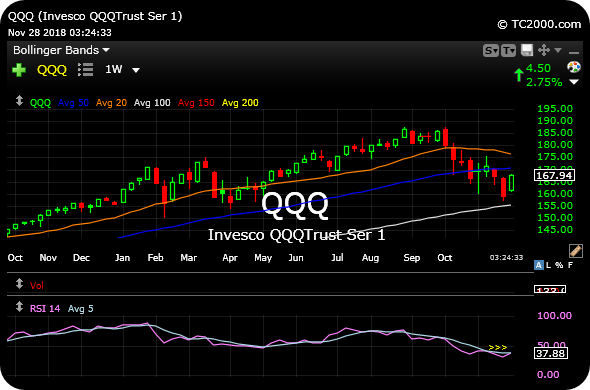
Since the broad market correction began, you will note on the bottom pane of the QQQ ETF weekly chart, below, that the RSI has been pinned below its 5-week moving average, a standard measure for this indicator.
For reference, the RSI is an acronym for the "Relative Strength Index," used to identify changes in technical momentum. On any given timeframe, above 50 is generally considered a bullish RSI, with above 70 viewed as overbought. Trending below 50 is considered a bearish RSI pattern, with below 30 considered oversold.
As you can see, the RSI has been in bearish territory below 50 since early-October, barely dipping into oversold territory.
However, if this current relief rally sees the RSI cross back over its 5-period weekly moving average it could illustrate a clear change in character from the correction, heretofore, where the 5-period served to reject the RSI so far.
While it may seem quaint, sometimes a simple bullish RSI crossover on a weekly timeframe for a major ETF like QQQ is good enough to signal a change in character. In the coming days, I will be looking to see if the RSI actually crosses back over and signals a beginning of the Christmas rally after a rough autumn.
Health Scares Be Darned: Chi... Stock Market Recap 11/28/18 ...


