30Sep2:59 pmEST
A Gold Top? Maybe. Maybe Not. Maybe Go to the Weekly Chart

Recent strength in the U.S. Dollar has coincided with a sharp pullback in the precious metals and mining complex, which should not be all that surprising considering the run the sector has had, by and large, since around Memorial Day.
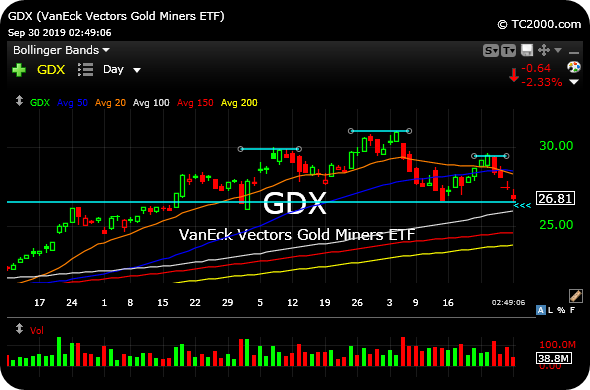
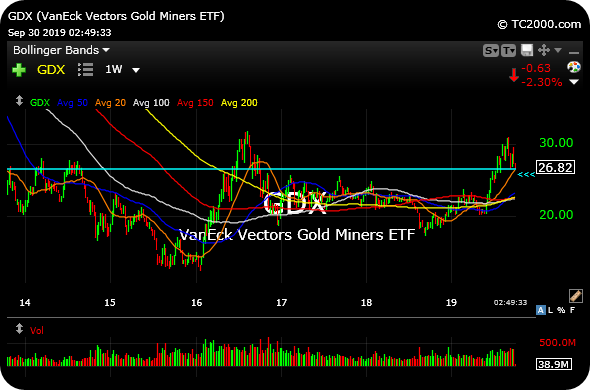
Still, once GDX (ETF for the senior gold miners, on its daily and weekly charts, respectively below) lost the $28 level we took it as a sign in recent sessions to lay off the action and simply let the pullback run its course. Recall that we are are still talking about commodities here, and corrections tend to be even more violent than many pullbacks in garden variety equities.
As a result of the weakness, you are seeing plenty of chatter on social media about GDX sporting a bearish head and shoulders topping pattern, one which I have highlighted for you in light blue on the first daily chart. You could practically see this coming a mile away, which begs the question a to whether this top is too obvious to actually prove true.
Furthermore, it is hard to imagine that the recent gold bull run has somehow reached anywhere close to euphoria, with more than enough gold skeptics to go around. In other words, I am inclined to think the current pullback is yet another harsh correction in what looks to be the makings of a potential long-term upside breakout for gold and her miners.
As usual, though, nothing will come easy for gold bugs, mocked and demoralized for years on end and gold sank lower and lower and each rally head-faked higher before swooning to new bear market lows.
Simply put, the second weekly chart of GDX, below, offers the better context. The rising 20-period moving average (orange line) is exactly where gold bugs should step up and put a floor underneath this dip. The weekly look is not so much a bearish top as it is a standard pullback or consolidation after a nice rally. Also note the price memory at the $26-$28 area for GDX going back to 2014--Indeed, this is a major spot.
Now let us take a step back.
If you will, think back to the summer of 2009 in equities. The S&P 500 Index had just staged one of the most spectacular squeezes off the 666 lows in early-March. We had gone sideways and flopped around for a while, sporting a similar head and shoulders top. Plenty of bears were out in full force pressing for the seemingly inevitable rollover to new bear market lows.
But it never came.
The head and shoulders top initially seemed to confirm lower, stopped on a dime and squeezed higher for what seemed like the next several years.
Gold bugs have a tall task to live up to that historical analogy. However, my point in conveying that history to you is that it will only be when we see standard bearish chart patterns on gold and her miners fail miserably that we will know for sure that the new gold bull market is here to stay.