24Mar12:08 pmEST
Market Chess Presents: The Chart of the Day

The rally since early last week has not rolled over so easily. And despite bears foaming at the mouth for an imminent dive to new lows, my concern with putting back on some aggressive shorts here is found, in part, on our chart of the day, below.
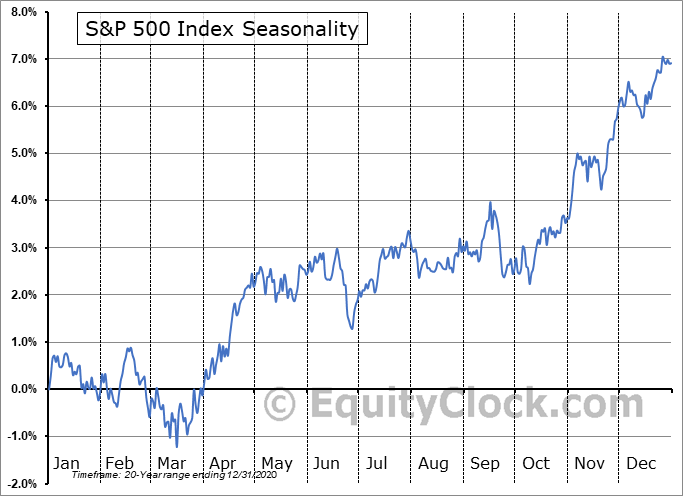
Courtesy of EquityClock.com, we have the seasonality by month for the S&P 500 Index over the first twenty years of this century, on average.
Clearly, the late-March through late-April interview we have entered is one of the most bullish times of the year. It may not be so simple this year, what with Russia, inflation, commodities going haywire, etc..
But even in 2008 there were periods of relative calm before the inevitable storm...
Either way, this chart makes for good food for thought and earns Chart of the Day honors.