01Mar10:52 amEST
It's Pretty; It's So Pretty

While equities toy with the 3940/3950 support zone on the S&P 500 Index, which of course coincides with the 200-day simple moving average, we have rates on the 10-Year Note hitting 4% once again this morning.
Further, while the Dollar had a soft overnight session we have the greenback firming up as we speak.
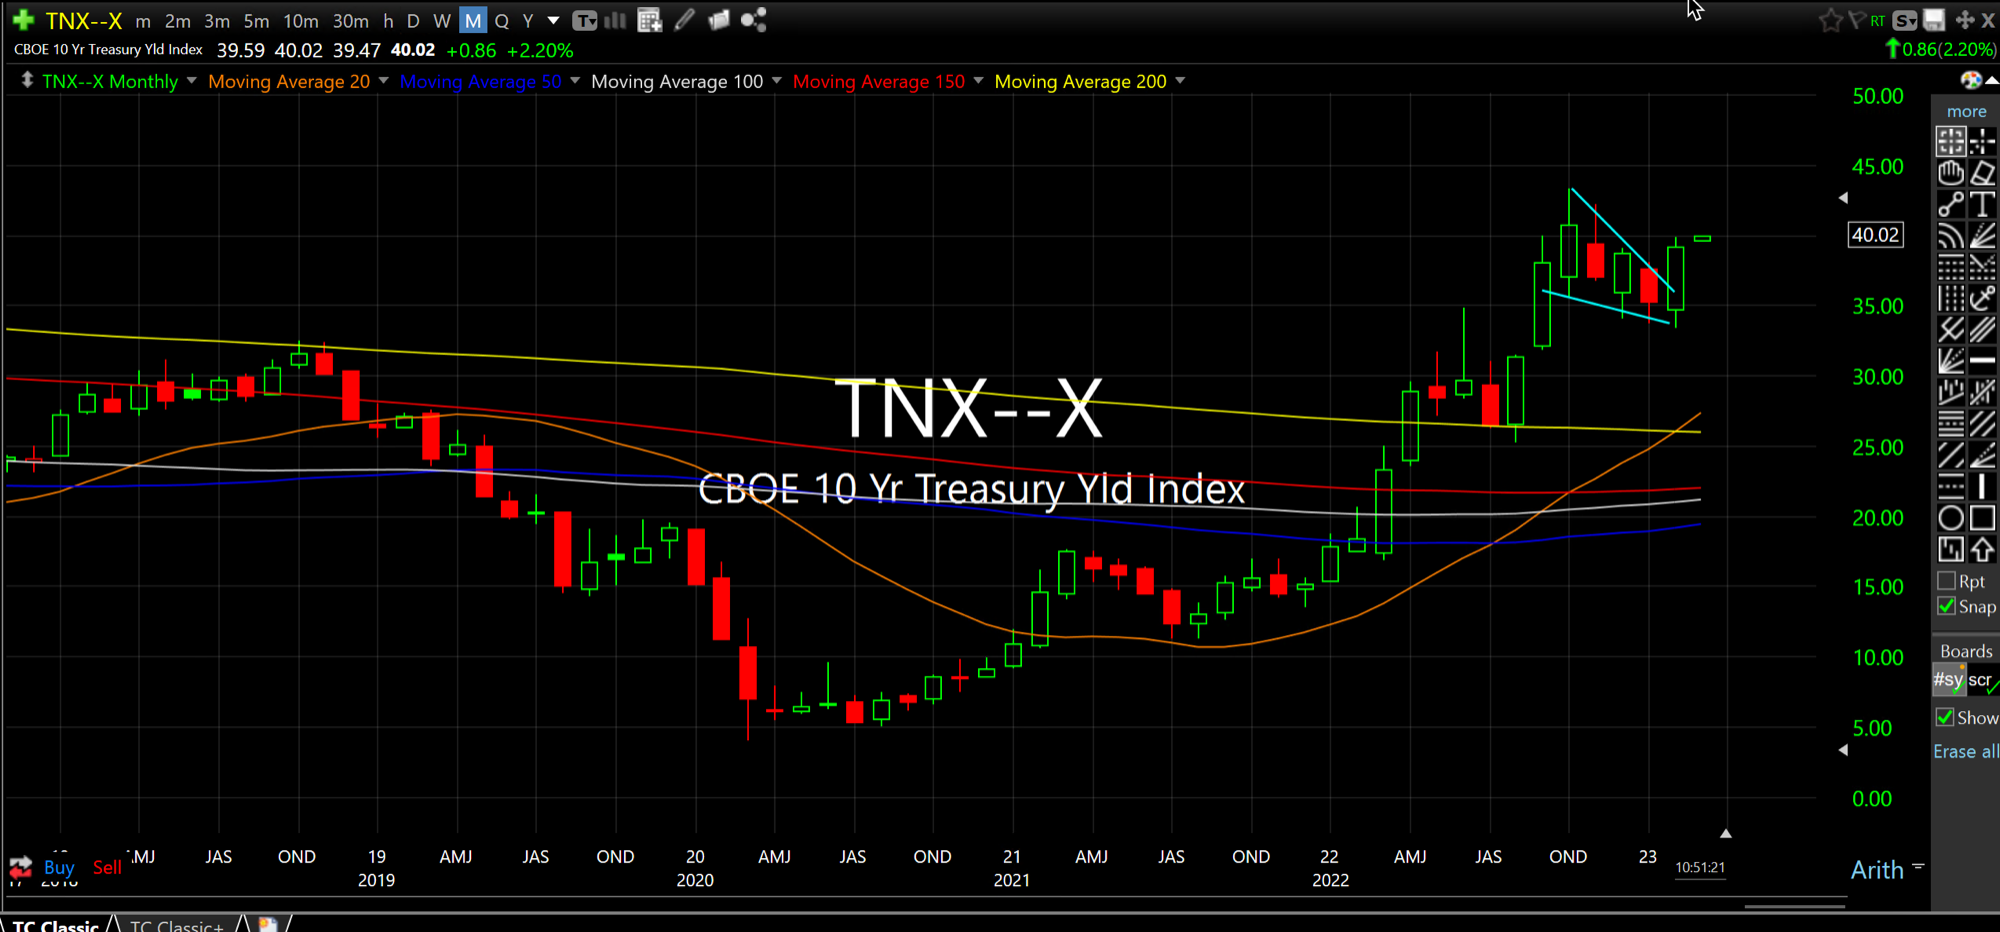
But turning back to rates, the updated monthly chart (below) for TNX, the Index for Rates on the 10-year ("40" equates to 4% on this Index, for example) shows us a beautiful multi-month bull flag which looks to be uncoiling higher.
I recognize it is difficult for the majority of Wall Street veterans to accept that this pattern can resolve much higher--After all, for most or all of their careers since the early-1980s rates have done nothing but steadily move lower in a genuine era of disinflation.
But despite Chair Powell's claim of disinflation having arrived earlier this winter that is, in fact, not yet the case. And the risk, once again, is higher rates for a longer period of time during this new inflationary secular regime.
The added "left tail," black swan risk also continues to be this chart rapidly moving higher much faster than folks had ever imagined, too.
As I see it, that is the most painful trade from here and therefore may very well be the most probable. At that point I think you will finally see equities realize the jig is up.
On second thought, I suppose beauty is in the eye of the beholder...