25Mar1:59 pmEST
No, This is Not Normal

After being lauded for its stock performance to new all-time highs earlier this winter, Walmart has quietly corrected sharply in recent weeks. As I just noted with Members, the daily chart looks like an actionable short idea, since the recent bounce attempt has not gained much traction and is now shaping up as a bear flag.
For our purposes in this analysis, however, we want to look longer-term at WMT.
Generally speaking, I agree with the notion that markets ebb-and-flow, with most instances of markets falling inline with historically familiar price action. Put another way, outliers are just that: Outlier scenarios which we are too prone to mistaking in real-time as the rule rather than the exception.
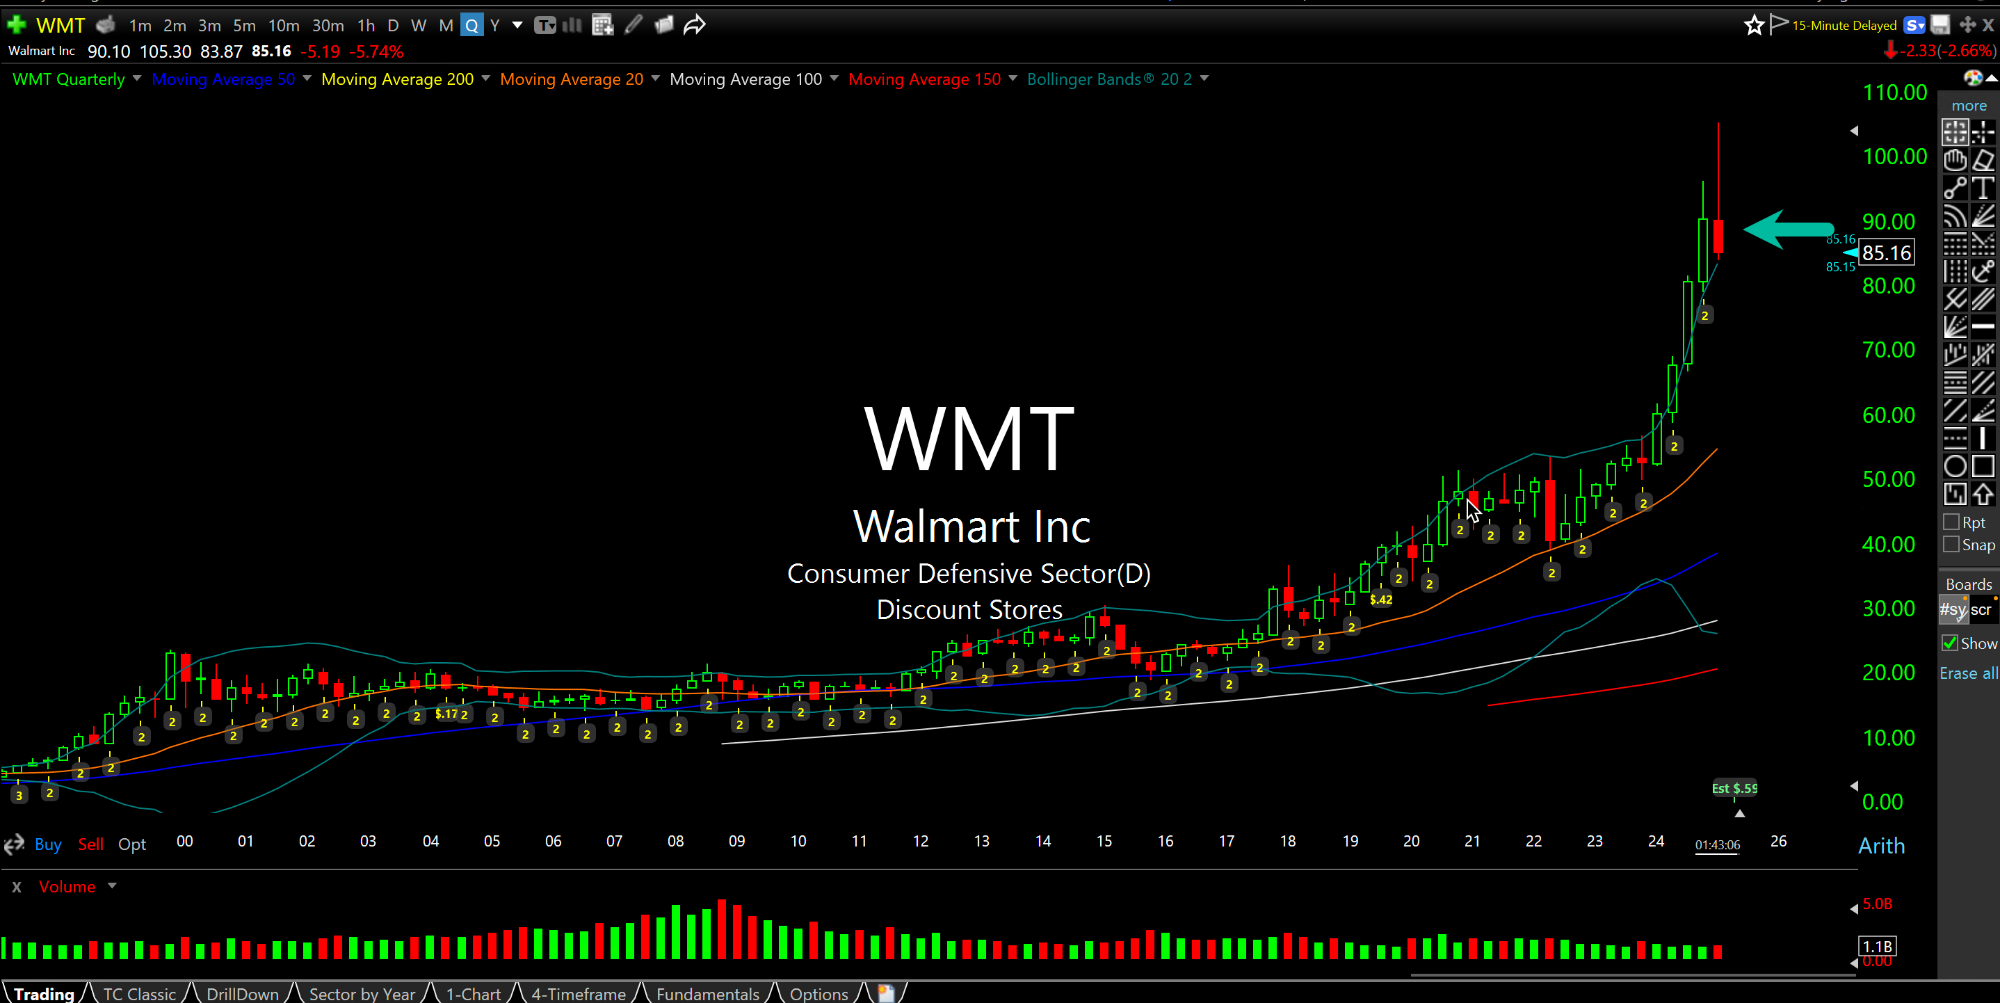
However, in this case we have a still-expensive WMT (roughly 29 times forward earnings) about to complete a quarterly candlestick the likes of which we may never see again in our lifetime on this type of name.
As an example, note previous instances when WMT topped out on a multi-quarter basis: There was never anything as dramatic as the current, massive bearish reversal (long skinny shadow, arrow) free and clear above the upper quarterly chart Bollinger Band after an epic, historically previous bull run.
This is not normal long-term action, which is nothing new if you have been following my work. As slow-moving as this cycle has been, complicated by a Fed and White House both playing with fire with sticky inflation, the fact remains that quite a few long-term charts like WMT are now flashing red flags after stretching out the rubber band to historical extremes.