30Apr12:12 pmEST
Claws Versus Horns
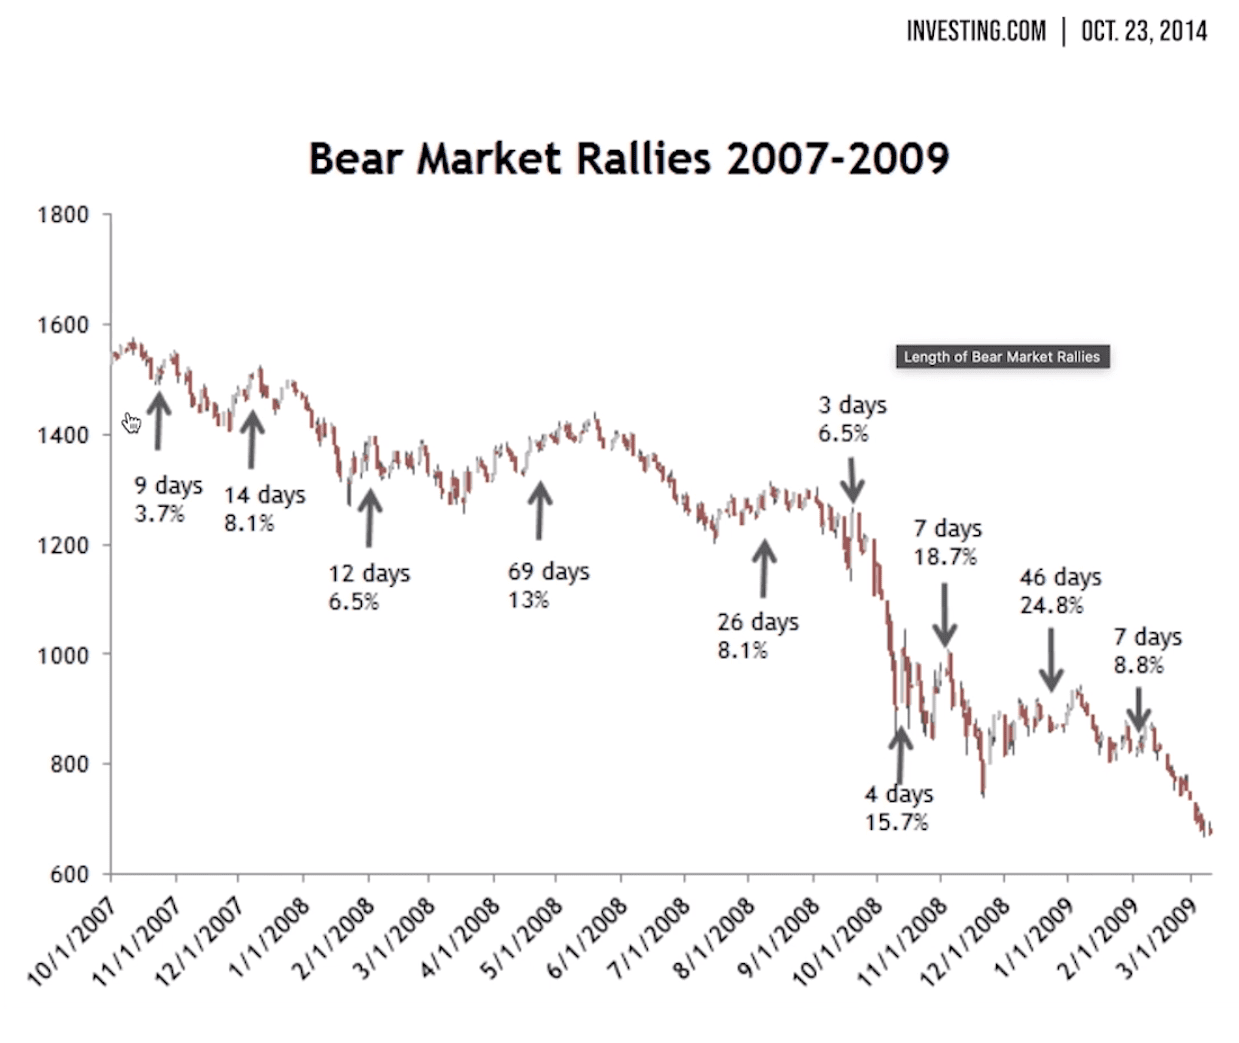
Courtesy of the Modern Wealth Management website, the below chart is instructive insofar as putting in to perspective just what a bear market rally actually looks like and how long it can last.
I define an ongoing bear market as the major indices primarily operating below a declining 200-day moving average, with attempts to regain the 200-day swiftly rejected.
As you can see, the bear market rallies in 2008 varied to a great degree in terms of both duration and percentage gain.
But the common denominator in each case was that we had retail players all-too-eager to assume the bottom was in, fairly low buy volume, a drifting type of nature to most of the up-days, and, above all else, the broad market eventually made a lower high and rolled back over to fresh lows.
In the current market, we have a similar dynamic to the above-listed qualities, though some major earnings and macro reports await us, namely META MSFT AAPL AMZN, the jobs reports, more inflation data, and Lord-knows-what from the trade wars.
But the pertinent issue is that bulls have already used up a ton of energy (short squeezes, bottom-calling, sentiment euphoria) to get to where we sit currently, yet the S&P, Nasdaq, and Russell all remain firmly below declining 200-day move averages.