
12Jan10:45 amEST
Big Round Numbers and Obvious Tests

After basically an inline CPI report, markets popped, reversed a bit lower, and are recovering now as I write this albeit with the Nasdaq slightly red. I still maintain this is the phase of the bear market where nonstop hope is attempting to singlehandedly reverse the dominant trend lower, but ultimately fails--We saw a similar situation in the spring, then summer of 2008, for example.
Of course, the challenging aspect is identifying the exact moment when the rally fails. And despite how many fancy signals, models, charts, data sets you may see thrown around I will let you in on a little secret: No one knows exactly when or where it will happen.
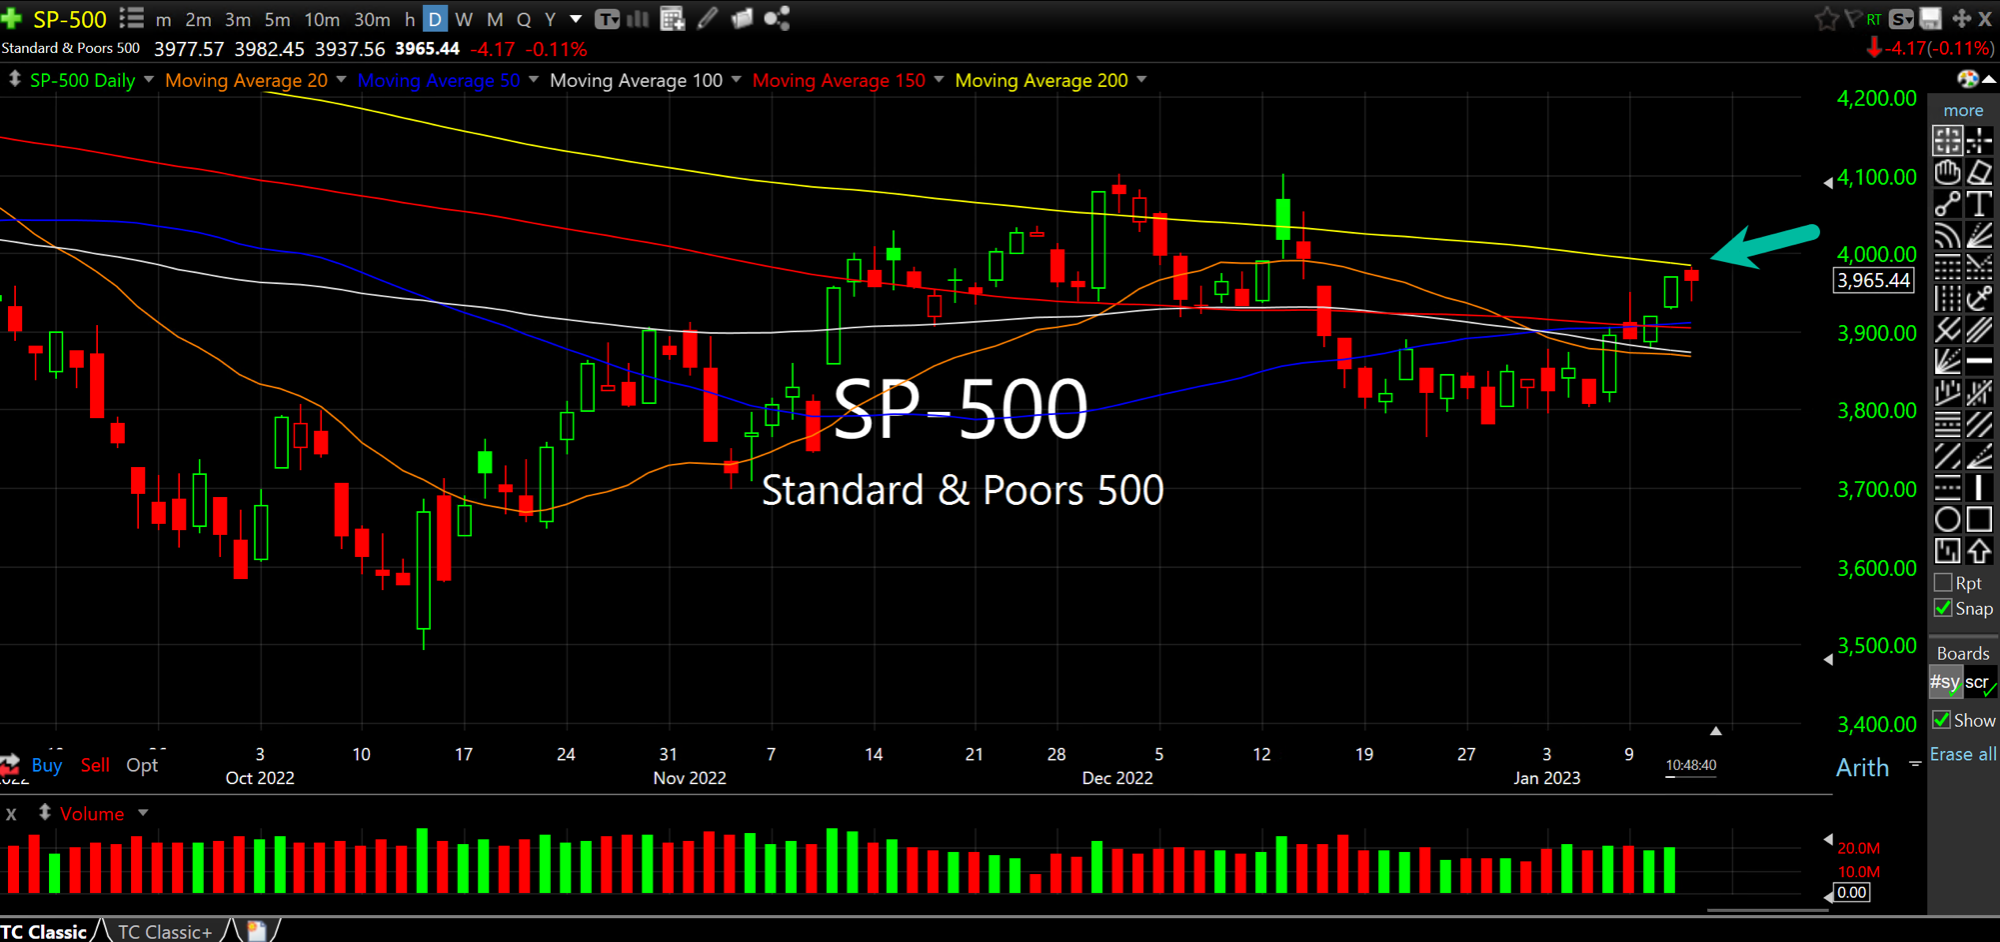
However, we can discuss odds and probabilities. And even though 4000 on the S&P 500 coincides around the 200-day moving average (yellow line, daily chart for S&P, below), it is likely too dramatic to place all of one's hope here for either the big clue of a new bull market or the exact spot where the rally fails.
No, with a new earnings season upon us in the coming weeks before the next FOMC, the issue is when the market begins to accept, the fear, the reality that the economy is slowing all the while The Fed will be intentionally behind the curve in eventually pausing, then easing again.
Rocket Emoji Leads to Failed... Stock Market Recap 03/25/21 ...


